| Param | Original file | Final file |
|---|---|---|
| Filename | modeM0/AS1A12_088T08_9000005748cztM0_level2.fits | modeM0/AS1A12_088T08_9000005748cztM0_level2_quad_clean.evt |
| Size (bytes) | 187,735,680 | 170,887,680 |
| Size | 179.0 MB | 163.0 MB |
| Events in quadrant A | 1,074,810 | 848,584 |
| Events in quadrant B | 1,101,430 | 1,028,128 |
| Events in quadrant C | 1,122,106 | 978,874 |
| Events in quadrant D | 938,408 | 871,023 |
| Mode SS | |||
|---|---|---|---|
| Quadrant | BADHDUFLAG | Total packets | Discarded packets |
| A | 0 | 428 | 0 |
| B | 0 | 428 | 0 |
| C | 0 | 428 | 0 |
| D | 0 | 428 | 0 |
| Mode M0 | |||
|---|---|---|---|
| Quadrant | BADHDUFLAG | Total packets | Discarded packets |
| A | 0 | 84760 | 0 |
| B | 0 | 43162 | 0 |
| C | 0 | 42421 | 0 |
| D | 0 | 55681 | 0 |
| Mode M9 | |||
|---|---|---|---|
| Quadrant | BADHDUFLAG | Total packets | Discarded packets |
| A | 0 | 89 | 0 |
| B | 0 | 89 | 0 |
| C | 0 | 89 | 0 |
| D | 0 | 90 | 0 |
| Quadrant | Total seconds | Saturated seconds | Saturation percentage |
|---|---|---|---|
| A | 21026 | 2173 | 10.334824% |
| B | 21026 | 84 | 0.399505% |
| C | 21026 | 25 | 0.118900% |
| D | 21026 | 1197 | 5.692952% |
Noise dominated data is calculated using 1-second bins in cleaned event files. If a bin has >2000 counts, and if more than 50% of those come from <1% of pixels, then it is considered to be noise-dominated and hence unusable.
| Quadrant | # 1 sec bins | Bins with >0 counts | Bins with >2000 counts | High rate bins dominated by noise | Noise dominated (total time) | Noise dominated (detector-on time) | Marked lightcurve |
|---|---|---|---|---|---|---|---|
| A | 28947 | 21025 | 0 | 0 | 0.00% | 0.00% | 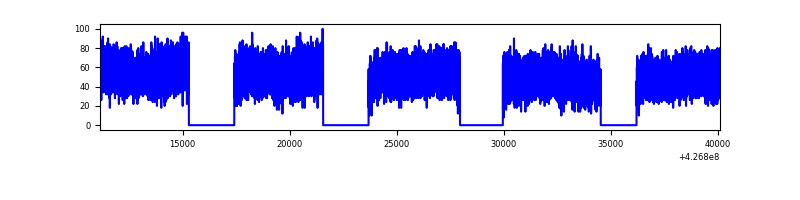 |
| B | 28947 | 21025 | 0 | 0 | 0.00% | 0.00% |  |
| C | 28947 | 21025 | 0 | 0 | 0.00% | 0.00% | 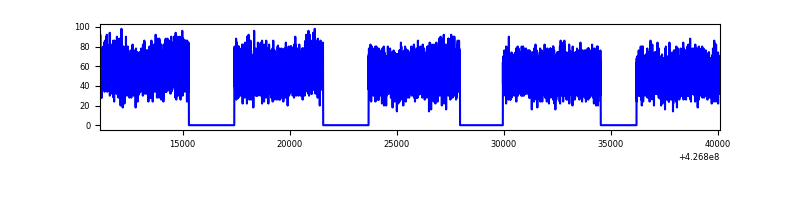 |
| D | 28947 | 20986 | 0 | 0 | 0.00% | 0.00% | 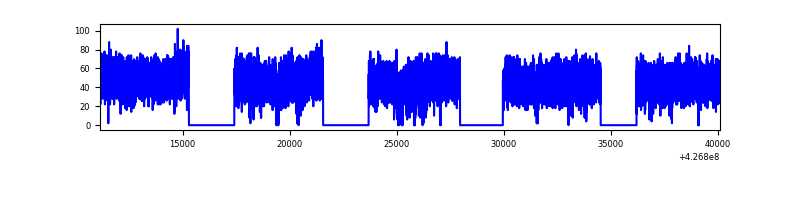 |
Top three noisy pixels from each quadrant. If the there are fewer than three noisy pixels in the level2.evt file, extra rows are filled as -1
| Pixel properties | Quadrant properties | ||||||
|---|---|---|---|---|---|---|---|
| Quadrant | DetID | PixID | Counts | Sigma | Mean | Median | Sigma |
| A | 7 | 110 | 908 | 9.09 | 280 | 262 | 71.1 |
| A | 9 | 19 | 897 | 8.94 | 280 | 262 | 71.1 |
| A | 0 | 29 | 870 | 8.56 | 280 | 262 | 71.1 |
| B | 2 | 9 | 923 | 10.8 | 291 | 277 | 59.8 |
| B | 3 | 17 | 814 | 8.98 | 291 | 277 | 59.8 |
| B | 2 | 8 | 761 | 8.1 | 291 | 277 | 59.8 |
| C | 1 | 80 | 909 | 8.17 | 296 | 277 | 77.4 |
| C | 1 | 81 | 899 | 8.04 | 296 | 277 | 77.4 |
| C | 3 | 203 | 876 | 7.74 | 296 | 277 | 77.4 |
| D | 7 | 3 | 688 | 6.07 | 268 | 244 | 73.1 |
| D | 6 | 62 | 672 | 5.85 | 268 | 244 | 73.1 |
| D | 6 | 67 | 670 | 5.83 | 268 | 244 | 73.1 |
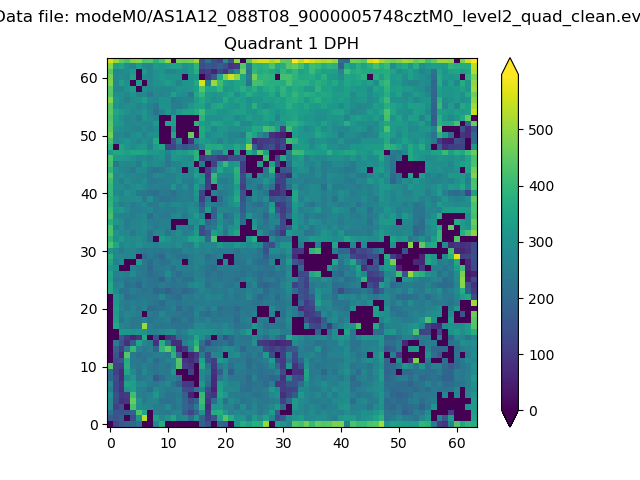
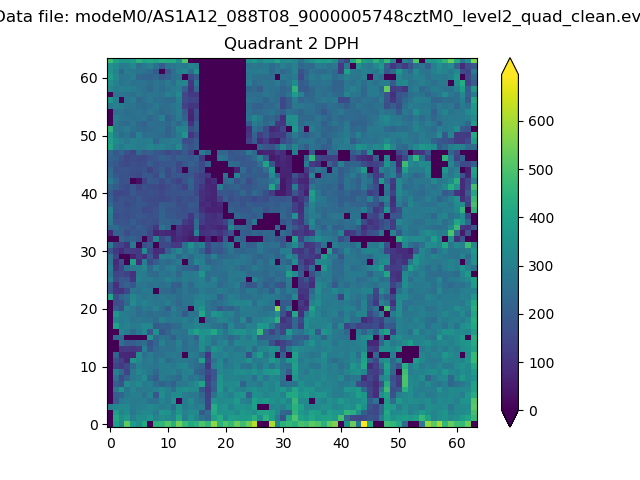
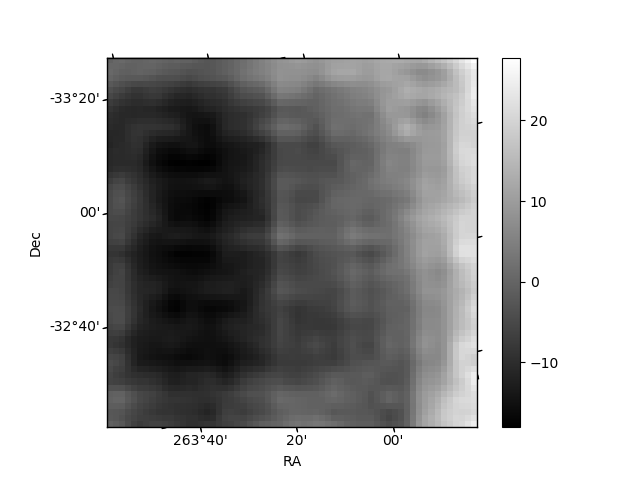
Histogram calculated using DETX and DETY for each event in the final _common_clean file
| Quadrant A | 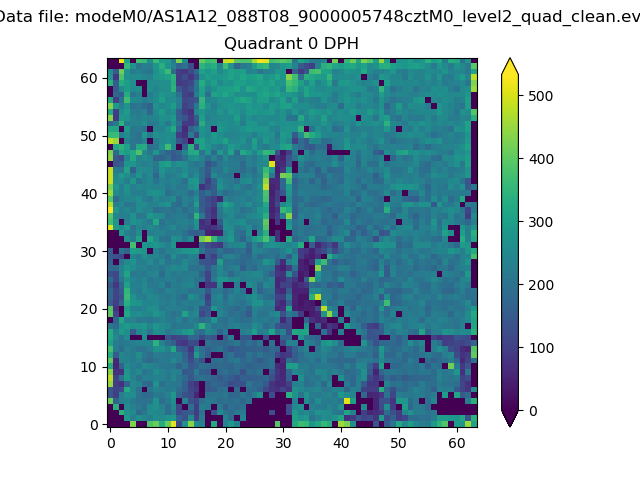 |
 |
Quadrant B |
|---|---|---|---|
| Quadrant D |  |
 |
Quadrant C |
| Plot type | Count rate plots | Images |
|---|---|---|
| Comparison with Poisson distribution Blue bars denote a histogram of data divided into 1 sec bins. Red curve is a Poisson curve with rate = median count rate of data. |
 |
 |
| Quadrant-wise count rates Data is divided into 100 sec bins |
 |
|
| Module-wise count rates for Quadrant A Data is divided into 100 sec bins |
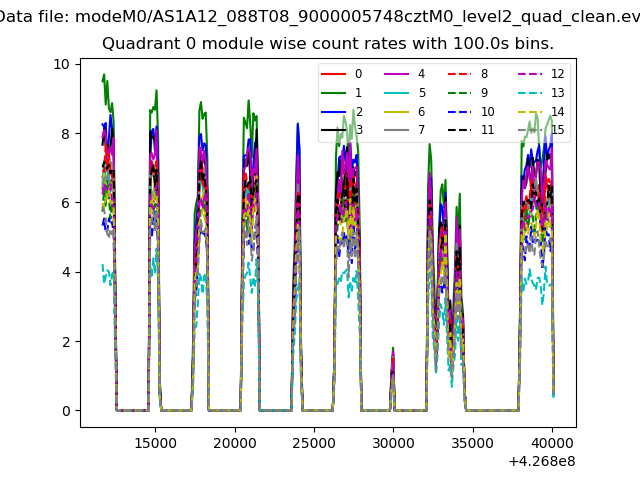 |
 |
| Module-wise count rates for Quadrant B Data is divided into 100 sec bins |
 |
 |
| Module-wise count rates for Quadrant C Data is divided into 100 sec bins |
 |
 |
| Module-wise count rates for Quadrant D Data is divided into 100 sec bins |
 |
 |
| Parameter | Plot |
|---|---|
| CZT HV Monitor |  |
| D_VDD | 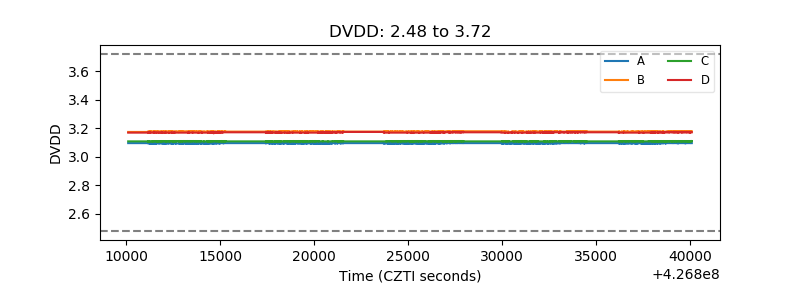 |
| Temperature 1 | 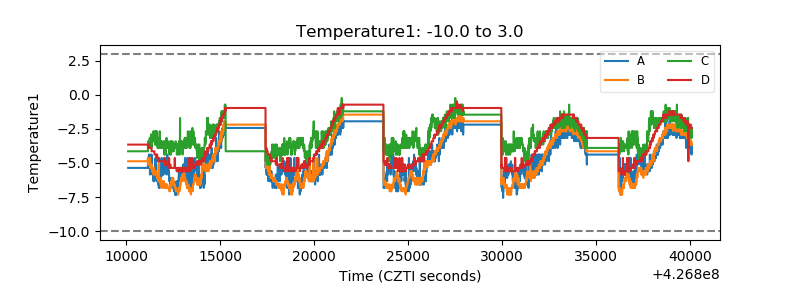 |
| Veto HV Monitor |  |
| Veto LLD |  |
| Alpha Counter |  |
| _CPM_Rate |  |
| CZT Counter |  |
| +2.5 Volts monitor |  |
| +5 Volts monitor |  |
| _ROLL_ROT |  |
| _Roll_DEC | 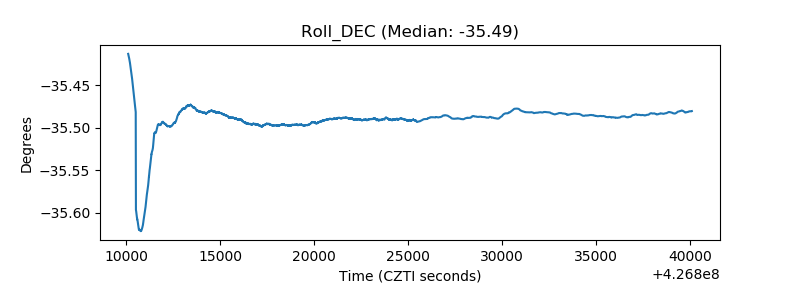 |
| _Roll_RA | 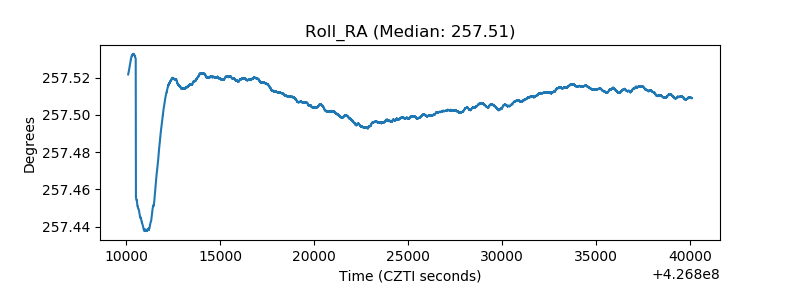 |
| Veto Counter | 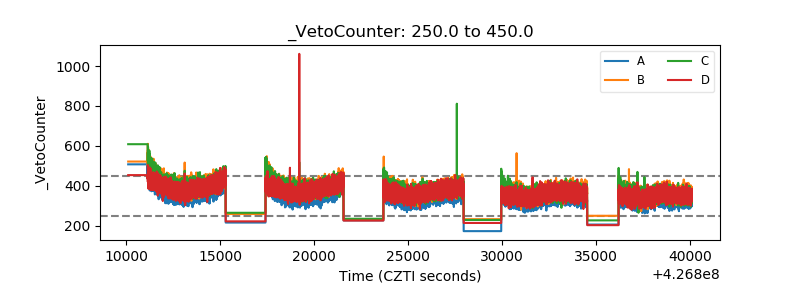 |