| Param | Original file | Final file |
|---|---|---|
| Filename | modeM0/AS1A12_099T03_9000005746cztM0_level2.fits | modeM0/AS1A12_099T03_9000005746cztM0_level2_quad_clean.evt |
| Size (bytes) | 118,497,600 | 110,718,720 |
| Size | 113.0 MB | 105.6 MB |
| Events in quadrant A | 686,306 | 623,474 |
| Events in quadrant B | 701,604 | 660,434 |
| Events in quadrant C | 708,176 | 621,288 |
| Events in quadrant D | 610,500 | 565,070 |
| Mode M0 | |||
|---|---|---|---|
| Quadrant | BADHDUFLAG | Total packets | Discarded packets |
| A | 0 | 48960 | 0 |
| B | 0 | 25978 | 0 |
| C | 0 | 25876 | 0 |
| D | 0 | 29533 | 0 |
| Mode M9 | |||
|---|---|---|---|
| Quadrant | BADHDUFLAG | Total packets | Discarded packets |
| A | 0 | 44 | 0 |
| B | 0 | 45 | 0 |
| C | 0 | 45 | 0 |
| D | 0 | 45 | 0 |
| Mode SS | |||
|---|---|---|---|
| Quadrant | BADHDUFLAG | Total packets | Discarded packets |
| A | 0 | 260 | 0 |
| B | 0 | 260 | 0 |
| C | 0 | 260 | 0 |
| D | 0 | 260 | 0 |
| Quadrant | Total seconds | Saturated seconds | Saturation percentage |
|---|---|---|---|
| A | 12760 | 880 | 6.896552% |
| B | 12760 | 27 | 0.211599% |
| C | 12760 | 10 | 0.078370% |
| D | 12760 | 231 | 1.810345% |
Noise dominated data is calculated using 1-second bins in cleaned event files. If a bin has >2000 counts, and if more than 50% of those come from <1% of pixels, then it is considered to be noise-dominated and hence unusable.
| Quadrant | # 1 sec bins | Bins with >0 counts | Bins with >2000 counts | High rate bins dominated by noise | Noise dominated (total time) | Noise dominated (detector-on time) | Marked lightcurve |
|---|---|---|---|---|---|---|---|
| A | 16525 | 12759 | 0 | 0 | 0.00% | 0.00% |  |
| B | 16525 | 12759 | 0 | 0 | 0.00% | 0.00% |  |
| C | 16525 | 12759 | 0 | 0 | 0.00% | 0.00% |  |
| D | 16525 | 12758 | 0 | 0 | 0.00% | 0.00% |  |
Top three noisy pixels from each quadrant. If the there are fewer than three noisy pixels in the level2.evt file, extra rows are filled as -1
| Pixel properties | Quadrant properties | ||||||
|---|---|---|---|---|---|---|---|
| Quadrant | DetID | PixID | Counts | Sigma | Mean | Median | Sigma |
| A | 0 | 29 | 536 | 7.91 | 179 | 169 | 46.4 |
| A | 7 | 110 | 529 | 7.76 | 179 | 169 | 46.4 |
| A | 9 | 19 | 524 | 7.65 | 179 | 169 | 46.4 |
| B | 2 | 9 | 593 | 10.95 | 185 | 177 | 38.0 |
| B | 3 | 80 | 508 | 8.72 | 185 | 177 | 38.0 |
| B | 2 | 8 | 498 | 8.45 | 185 | 177 | 38.0 |
| C | 1 | 81 | 620 | 8.98 | 187 | 176 | 49.5 |
| C | 3 | 202 | 584 | 8.25 | 187 | 176 | 49.5 |
| C | 1 | 80 | 556 | 7.68 | 187 | 176 | 49.5 |
| D | 11 | 66 | 449 | 6.16 | 174 | 159 | 47.1 |
| D | 6 | 62 | 445 | 6.08 | 174 | 159 | 47.1 |
| D | 6 | 67 | 442 | 6.01 | 174 | 159 | 47.1 |
Histogram calculated using DETX and DETY for each event in the final _common_clean file
| Quadrant A | 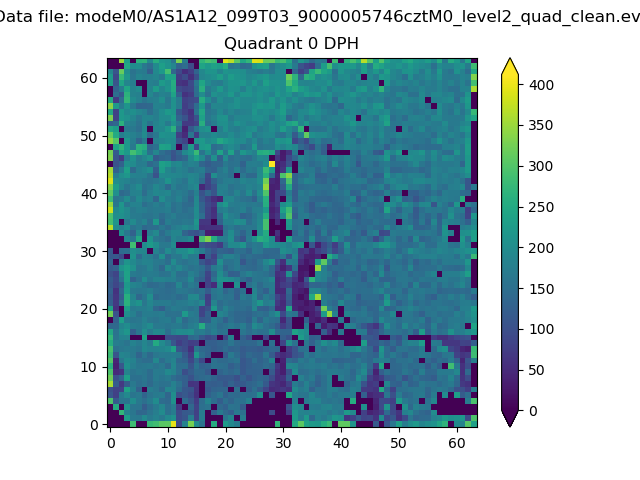 |
 |
Quadrant B |
|---|---|---|---|
| Quadrant D |  |
 |
Quadrant C |
| Plot type | Count rate plots | Images |
|---|---|---|
| Comparison with Poisson distribution Blue bars denote a histogram of data divided into 1 sec bins. Red curve is a Poisson curve with rate = median count rate of data. |
 |
 |
| Quadrant-wise count rates Data is divided into 100 sec bins |
 |
|
| Module-wise count rates for Quadrant A Data is divided into 100 sec bins |
 |
 |
| Module-wise count rates for Quadrant B Data is divided into 100 sec bins |
 |
 |
| Module-wise count rates for Quadrant C Data is divided into 100 sec bins |
 |
 |
| Module-wise count rates for Quadrant D Data is divided into 100 sec bins |
 |
 |
| Parameter | Plot |
|---|---|
| CZT HV Monitor |  |
| D_VDD | 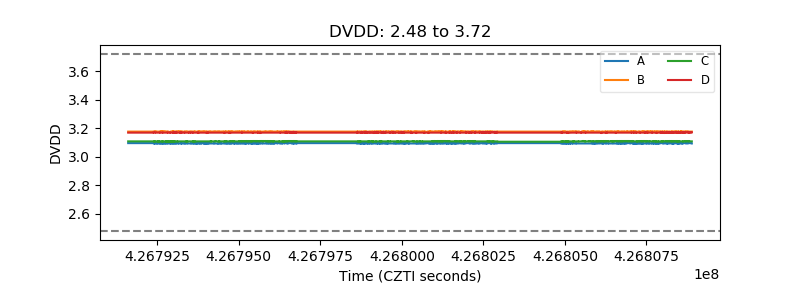 |
| Temperature 1 |  |
| Veto HV Monitor |  |
| Veto LLD |  |
| Alpha Counter |  |
| _CPM_Rate | 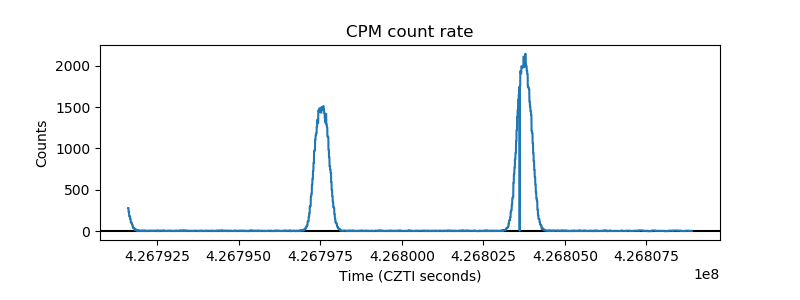 |
| CZT Counter |  |
| +2.5 Volts monitor |  |
| +5 Volts monitor |  |
| _ROLL_ROT |  |
| _Roll_DEC |  |
| _Roll_RA |  |
| Veto Counter |  |