| Param | Original file | Final file |
|---|---|---|
| Filename | modeM0/AS1A12_088T19_9000005754cztM0_level2.fits | modeM0/AS1A12_088T19_9000005754cztM0_level2_quad_clean.evt |
| Size (bytes) | 86,915,520 | 71,809,920 |
| Size | 82.9 MB | 68.5 MB |
| Events in quadrant A | 521,234 | 397,744 |
| Events in quadrant B | 501,406 | 405,086 |
| Events in quadrant C | 515,216 | 384,545 |
| Events in quadrant D | 426,592 | 318,592 |
| Mode SS | |||
|---|---|---|---|
| Quadrant | BADHDUFLAG | Total packets | Discarded packets |
| A | 0 | 196 | 0 |
| B | 0 | 196 | 0 |
| C | 0 | 196 | 0 |
| D | 0 | 196 | 0 |
| Mode M9 | |||
|---|---|---|---|
| Quadrant | BADHDUFLAG | Total packets | Discarded packets |
| A | 0 | 43 | 0 |
| B | 0 | 43 | 0 |
| C | 0 | 43 | 0 |
| D | 0 | 43 | 0 |
| Mode M0 | |||
|---|---|---|---|
| Quadrant | BADHDUFLAG | Total packets | Discarded packets |
| A | 0 | 20739 | 0 |
| B | 0 | 19719 | 0 |
| C | 0 | 19422 | 0 |
| D | 0 | 27303 | 0 |
| Quadrant | Total seconds | Saturated seconds | Saturation percentage |
|---|---|---|---|
| A | 9635 | 16 | 0.166061% |
| B | 9635 | 19 | 0.197198% |
| C | 9635 | 8 | 0.083031% |
| D | 9634 | 714 | 7.411252% |
Noise dominated data is calculated using 1-second bins in cleaned event files. If a bin has >2000 counts, and if more than 50% of those come from <1% of pixels, then it is considered to be noise-dominated and hence unusable.
| Quadrant | # 1 sec bins | Bins with >0 counts | Bins with >2000 counts | High rate bins dominated by noise | Noise dominated (total time) | Noise dominated (detector-on time) | Marked lightcurve |
|---|---|---|---|---|---|---|---|
| A | 13310 | 9634 | 0 | 0 | 0.00% | 0.00% |  |
| B | 13310 | 9634 | 0 | 0 | 0.00% | 0.00% |  |
| C | 13310 | 9634 | 0 | 0 | 0.00% | 0.00% |  |
| D | 13309 | 9627 | 0 | 0 | 0.00% | 0.00% | 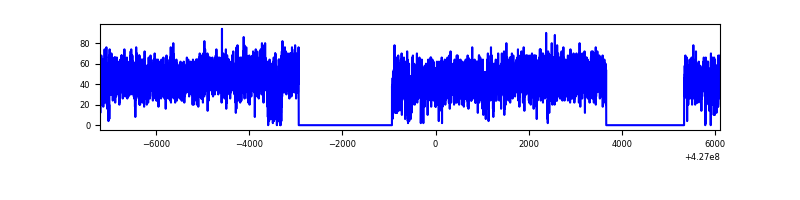 |
Top three noisy pixels from each quadrant. If the there are fewer than three noisy pixels in the level2.evt file, extra rows are filled as -1
| Pixel properties | Quadrant properties | ||||||
|---|---|---|---|---|---|---|---|
| Quadrant | DetID | PixID | Counts | Sigma | Mean | Median | Sigma |
| A | 9 | 19 | 435 | 8.58 | 135 | 127 | 35.9 |
| A | 7 | 110 | 417 | 8.08 | 135 | 127 | 35.9 |
| A | 15 | 236 | 401 | 7.63 | 135 | 127 | 35.9 |
| B | 2 | 9 | 433 | 10.9 | 132 | 126 | 28.2 |
| B | 2 | 8 | 357 | 8.2 | 132 | 126 | 28.2 |
| B | 3 | 80 | 341 | 7.63 | 132 | 126 | 28.2 |
| C | 1 | 80 | 415 | 7.88 | 136 | 128 | 36.4 |
| C | 1 | 81 | 413 | 7.83 | 136 | 128 | 36.4 |
| C | 7 | 221 | 388 | 7.14 | 136 | 128 | 36.4 |
| D | 10 | 189 | 352 | 7.04 | 122 | 111 | 34.2 |
| D | 11 | 66 | 334 | 6.51 | 122 | 111 | 34.2 |
| D | 6 | 38 | 318 | 6.04 | 122 | 111 | 34.2 |
Histogram calculated using DETX and DETY for each event in the final _common_clean file
| Quadrant A | 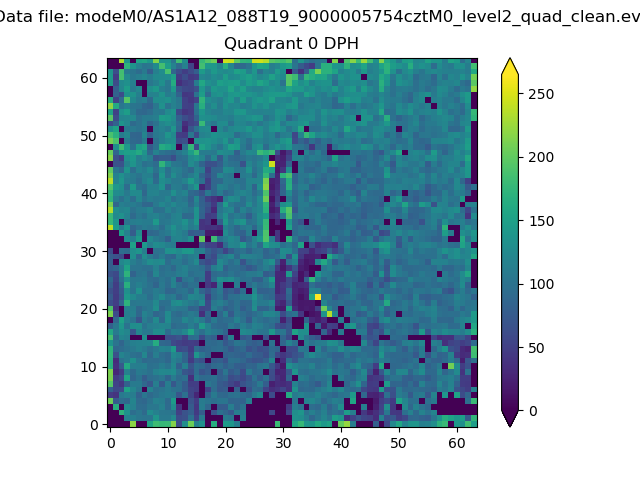 |
 |
Quadrant B |
|---|---|---|---|
| Quadrant D |  |
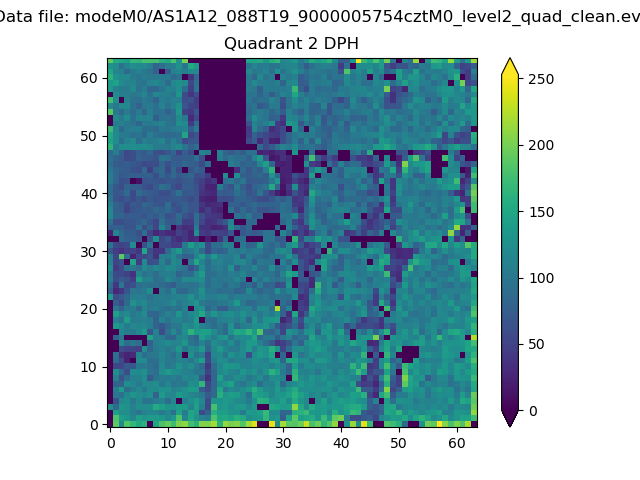 |
Quadrant C |
| Plot type | Count rate plots | Images |
|---|---|---|
| Comparison with Poisson distribution Blue bars denote a histogram of data divided into 1 sec bins. Red curve is a Poisson curve with rate = median count rate of data. |
 |
 |
| Quadrant-wise count rates Data is divided into 100 sec bins |
 |
|
| Module-wise count rates for Quadrant A Data is divided into 100 sec bins |
 |
 |
| Module-wise count rates for Quadrant B Data is divided into 100 sec bins |
 |
 |
| Module-wise count rates for Quadrant C Data is divided into 100 sec bins |
 |
 |
| Module-wise count rates for Quadrant D Data is divided into 100 sec bins |
 |
 |
| Parameter | Plot |
|---|---|
| CZT HV Monitor |  |
| D_VDD |  |
| Temperature 1 |  |
| Veto HV Monitor |  |
| Veto LLD |  |
| Alpha Counter |  |
| _CPM_Rate |  |
| CZT Counter |  |
| +2.5 Volts monitor |  |
| +5 Volts monitor |  |
| _ROLL_ROT |  |
| _Roll_DEC |  |
| _Roll_RA |  |
| Veto Counter |  |