| Param | Original file | Final file |
|---|---|---|
| Filename | modeM0/AS1C07_001T11_9000005760cztM0_level2.fits | modeM0/AS1C07_001T11_9000005760cztM0_level2_quad_clean.evt |
| Size (bytes) | 38,793,600 | 57,458,880 |
| Size | 37.0 MB | 54.8 MB |
| Events in quadrant A | 227,778 | 367,715 |
| Events in quadrant B | 224,912 | 375,189 |
| Events in quadrant C | 233,158 | 374,545 |
| Events in quadrant D | 192,234 | 325,172 |
| Mode M0 | |||
|---|---|---|---|
| Quadrant | BADHDUFLAG | Total packets | Discarded packets |
| A | 0 | 10018 | 0 |
| B | 0 | 9536 | 0 |
| C | 0 | 8498 | 0 |
| D | 0 | 12947 | 0 |
| Mode M9 | |||
|---|---|---|---|
| Quadrant | BADHDUFLAG | Total packets | Discarded packets |
| A | 0 | 26 | 0 |
| B | 0 | 27 | 0 |
| C | 0 | 27 | 0 |
| D | 0 | 27 | 0 |
| Mode SS | |||
|---|---|---|---|
| Quadrant | BADHDUFLAG | Total packets | Discarded packets |
| A | 0 | 86 | 0 |
| B | 0 | 86 | 0 |
| C | 0 | 86 | 0 |
| D | 0 | 86 | 0 |
| Quadrant | Total seconds | Saturated seconds | Saturation percentage |
|---|---|---|---|
| A | 4216 | 64 | 1.518027% |
| B | 4216 | 55 | 1.304554% |
| C | 4216 | 2 | 0.047438% |
| D | 4216 | 309 | 7.329222% |
Noise dominated data is calculated using 1-second bins in cleaned event files. If a bin has >2000 counts, and if more than 50% of those come from <1% of pixels, then it is considered to be noise-dominated and hence unusable.
| Quadrant | # 1 sec bins | Bins with >0 counts | Bins with >2000 counts | High rate bins dominated by noise | Noise dominated (total time) | Noise dominated (detector-on time) | Marked lightcurve |
|---|---|---|---|---|---|---|---|
| A | 6278 | 4208 | 0 | 0 | 0.00% | 0.00% |  |
| B | 6278 | 4215 | 0 | 0 | 0.00% | 0.00% |  |
| C | 6278 | 4215 | 0 | 0 | 0.00% | 0.00% |  |
| D | 6277 | 4211 | 0 | 0 | 0.00% | 0.00% |  |
Top three noisy pixels from each quadrant. If the there are fewer than three noisy pixels in the level2.evt file, extra rows are filled as -1
| Pixel properties | Quadrant properties | ||||||
|---|---|---|---|---|---|---|---|
| Quadrant | DetID | PixID | Counts | Sigma | Mean | Median | Sigma |
| A | 7 | 110 | 206 | 9.12 | 59 | 56 | 16.4 |
| A | 0 | 29 | 183 | 7.73 | 59 | 56 | 16.4 |
| A | 9 | 19 | 178 | 7.42 | 59 | 56 | 16.4 |
| B | 2 | 9 | 206 | 10.76 | 59 | 57 | 13.9 |
| B | 3 | 80 | 169 | 8.08 | 59 | 57 | 13.9 |
| B | 14 | 254 | 160 | 7.43 | 59 | 57 | 13.9 |
| C | 1 | 81 | 211 | 8.66 | 61 | 58 | 17.7 |
| C | 1 | 80 | 199 | 7.98 | 61 | 58 | 17.7 |
| C | 1 | 65 | 197 | 7.87 | 61 | 58 | 17.7 |
| D | 4 | 160 | 156 | 6.48 | 54 | 49 | 16.5 |
| D | 1 | 19 | 150 | 6.12 | 54 | 49 | 16.5 |
| D | 15 | 46 | 149 | 6.06 | 54 | 49 | 16.5 |
Histogram calculated using DETX and DETY for each event in the final _common_clean file
| Quadrant A | 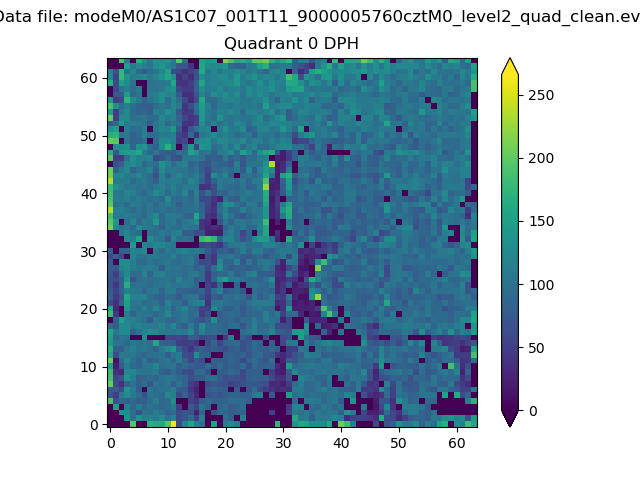 |
 |
Quadrant B |
|---|---|---|---|
| Quadrant D |  |
 |
Quadrant C |
| Plot type | Count rate plots | Images |
|---|---|---|
| Comparison with Poisson distribution Blue bars denote a histogram of data divided into 1 sec bins. Red curve is a Poisson curve with rate = median count rate of data. |
 |
 |
| Quadrant-wise count rates Data is divided into 100 sec bins |
 |
|
| Module-wise count rates for Quadrant A Data is divided into 100 sec bins |
 |
 |
| Module-wise count rates for Quadrant B Data is divided into 100 sec bins |
 |
 |
| Module-wise count rates for Quadrant C Data is divided into 100 sec bins |
 |
 |
| Module-wise count rates for Quadrant D Data is divided into 100 sec bins |
 |
 |
| Parameter | Plot |
|---|---|
| CZT HV Monitor |  |
| D_VDD |  |
| Temperature 1 |  |
| Veto HV Monitor |  |
| Veto LLD |  |
| Alpha Counter |  |
| _CPM_Rate |  |
| CZT Counter |  |
| +2.5 Volts monitor |  |
| +5 Volts monitor |  |
| _ROLL_ROT |  |
| _Roll_DEC |  |
| _Roll_RA |  |
| Veto Counter |  |