| Param | Original file | Final file |
|---|---|---|
| Filename | modeM0/AS1A12_088T23_9000005762cztM0_level2.fits | modeM0/AS1A12_088T23_9000005762cztM0_level2_quad_clean.evt |
| Size (bytes) | 76,720,320 | 68,808,960 |
| Size | 73.2 MB | 65.6 MB |
| Events in quadrant A | 450,646 | 377,928 |
| Events in quadrant B | 444,472 | 394,716 |
| Events in quadrant C | 457,066 | 380,887 |
| Events in quadrant D | 375,956 | 334,014 |
| Mode SS | |||
|---|---|---|---|
| Quadrant | BADHDUFLAG | Total packets | Discarded packets |
| A | 0 | 176 | 0 |
| B | 0 | 176 | 0 |
| C | 0 | 176 | 0 |
| D | 0 | 176 | 0 |
| Mode M9 | |||
|---|---|---|---|
| Quadrant | BADHDUFLAG | Total packets | Discarded packets |
| A | 0 | 55 | 0 |
| B | 0 | 56 | 0 |
| C | 0 | 56 | 0 |
| D | 0 | 56 | 0 |
| Mode M0 | |||
|---|---|---|---|
| Quadrant | BADHDUFLAG | Total packets | Discarded packets |
| A | 0 | 20965 | 0 |
| B | 0 | 18829 | 0 |
| C | 0 | 17265 | 0 |
| D | 0 | 25967 | 0 |
| Quadrant | Total seconds | Saturated seconds | Saturation percentage |
|---|---|---|---|
| A | 8573 | 166 | 1.936312% |
| B | 8573 | 39 | 0.454917% |
| C | 8573 | 5 | 0.058323% |
| D | 8573 | 602 | 7.022046% |
Noise dominated data is calculated using 1-second bins in cleaned event files. If a bin has >2000 counts, and if more than 50% of those come from <1% of pixels, then it is considered to be noise-dominated and hence unusable.
| Quadrant | # 1 sec bins | Bins with >0 counts | Bins with >2000 counts | High rate bins dominated by noise | Noise dominated (total time) | Noise dominated (detector-on time) | Marked lightcurve |
|---|---|---|---|---|---|---|---|
| A | 12698 | 8571 | 0 | 0 | 0.00% | 0.00% |  |
| B | 12698 | 8572 | 0 | 0 | 0.00% | 0.00% | 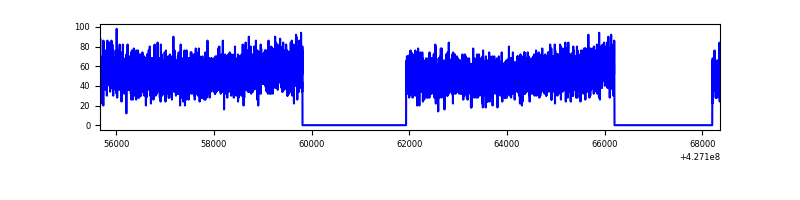 |
| C | 12698 | 8572 | 0 | 0 | 0.00% | 0.00% | 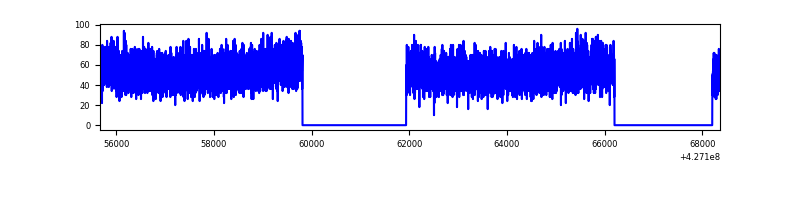 |
| D | 12698 | 8563 | 0 | 0 | 0.00% | 0.00% | 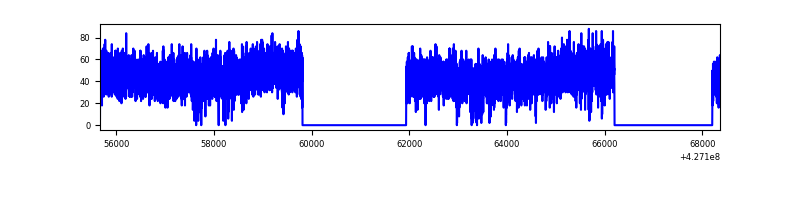 |
Top three noisy pixels from each quadrant. If the there are fewer than three noisy pixels in the level2.evt file, extra rows are filled as -1
| Pixel properties | Quadrant properties | ||||||
|---|---|---|---|---|---|---|---|
| Quadrant | DetID | PixID | Counts | Sigma | Mean | Median | Sigma |
| A | 0 | 29 | 380 | 8.63 | 117 | 110 | 31.3 |
| A | 14 | 95 | 375 | 8.47 | 117 | 110 | 31.3 |
| A | 7 | 110 | 372 | 8.37 | 117 | 110 | 31.3 |
| B | 2 | 9 | 375 | 10.26 | 117 | 112 | 25.6 |
| B | 2 | 8 | 329 | 8.47 | 117 | 112 | 25.6 |
| B | 5 | 128 | 324 | 8.27 | 117 | 112 | 25.6 |
| C | 1 | 81 | 373 | 8.09 | 120 | 113 | 32.1 |
| C | 1 | 80 | 345 | 7.22 | 120 | 113 | 32.1 |
| C | 3 | 203 | 341 | 7.1 | 120 | 113 | 32.1 |
| D | 6 | 67 | 311 | 7.09 | 107 | 97 | 30.2 |
| D | 11 | 66 | 287 | 6.29 | 107 | 97 | 30.2 |
| D | 3 | 14 | 286 | 6.26 | 107 | 97 | 30.2 |
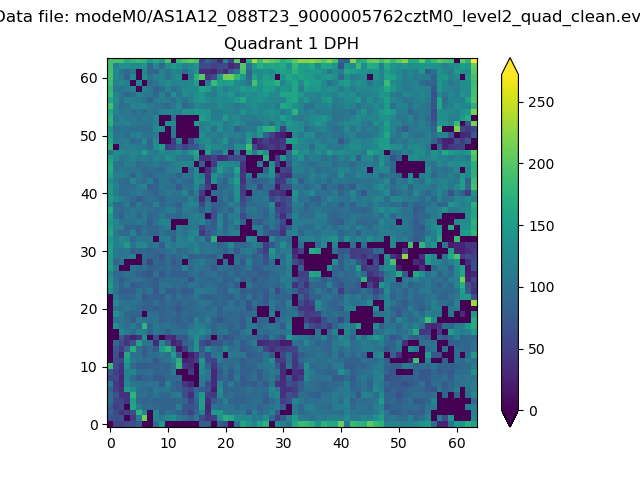
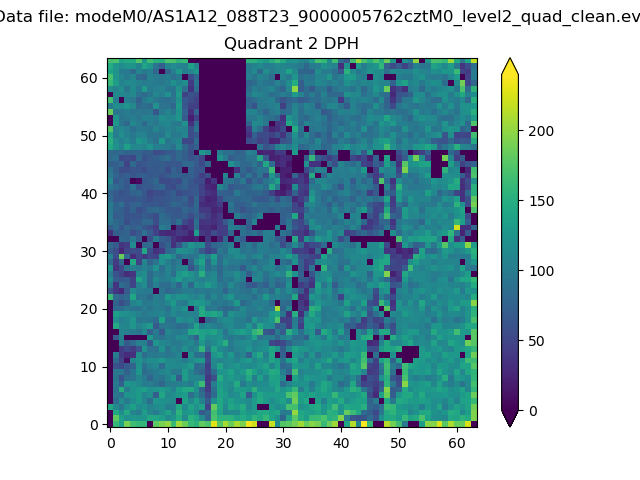
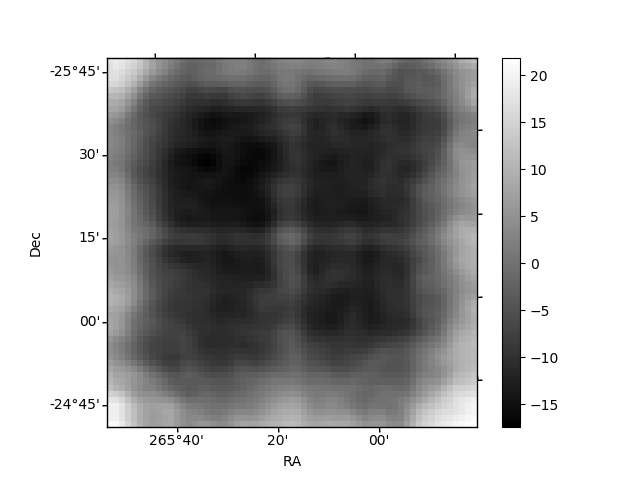
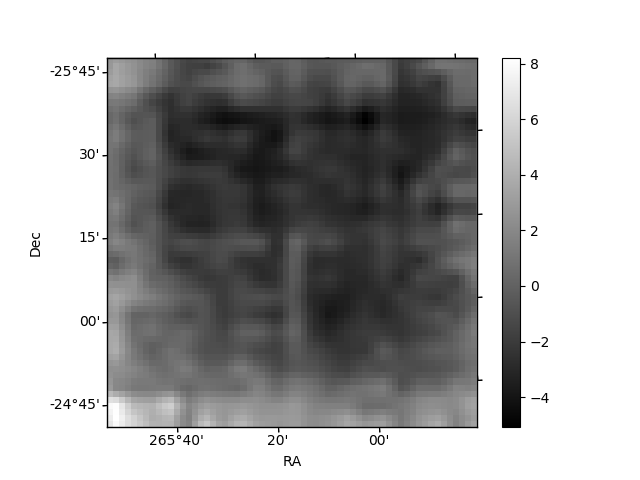
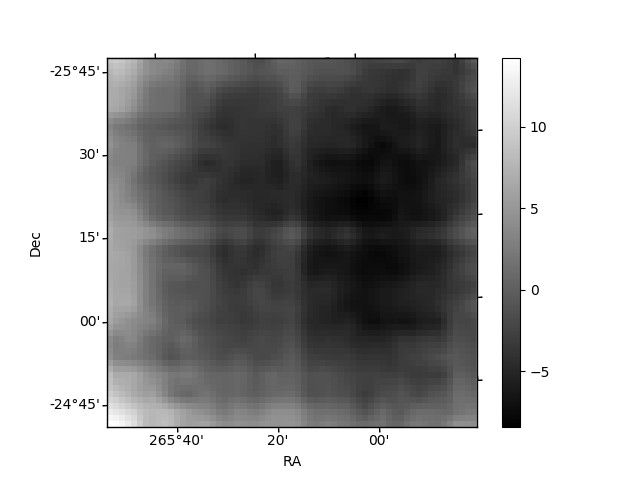
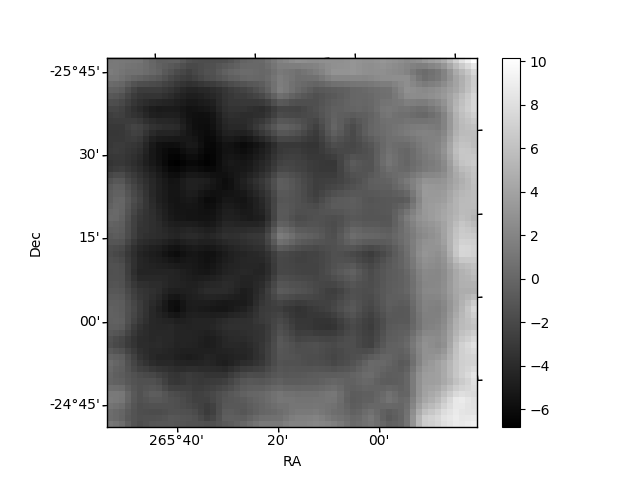
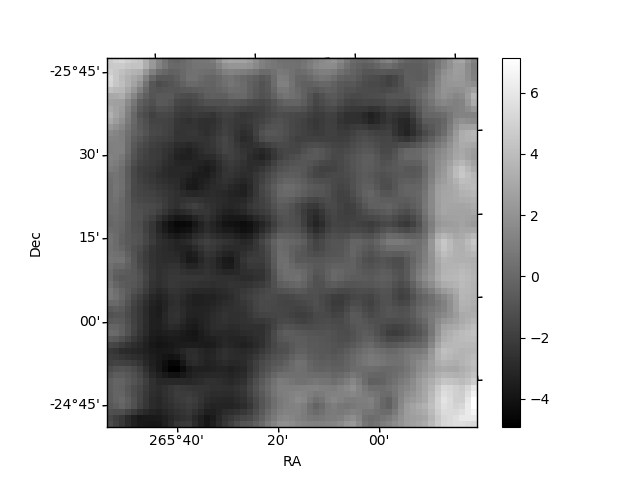
Histogram calculated using DETX and DETY for each event in the final _common_clean file
| Quadrant A | 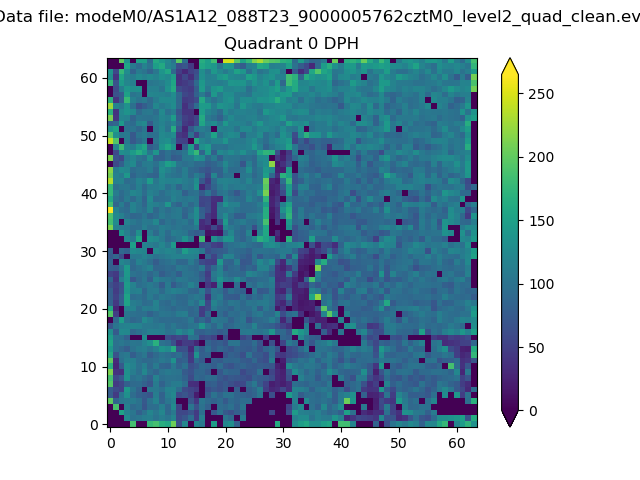 |
 |
Quadrant B |
|---|---|---|---|
| Quadrant D | 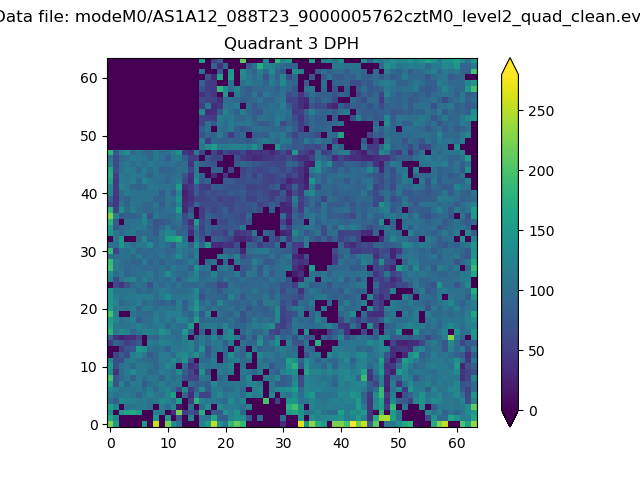 |
 |
Quadrant C |
| Plot type | Count rate plots | Images |
|---|---|---|
| Comparison with Poisson distribution Blue bars denote a histogram of data divided into 1 sec bins. Red curve is a Poisson curve with rate = median count rate of data. |
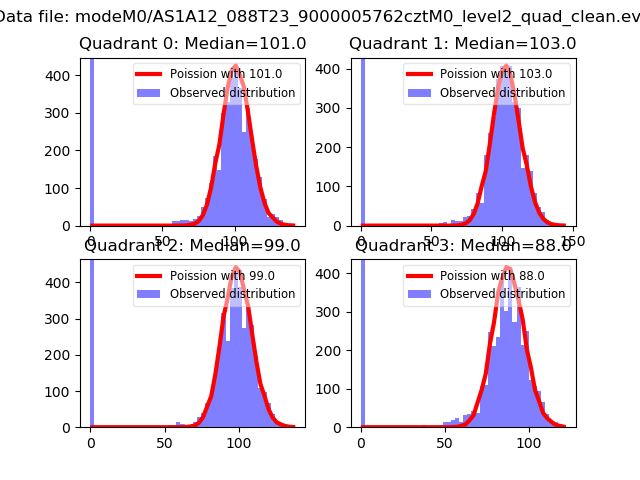 |
 |
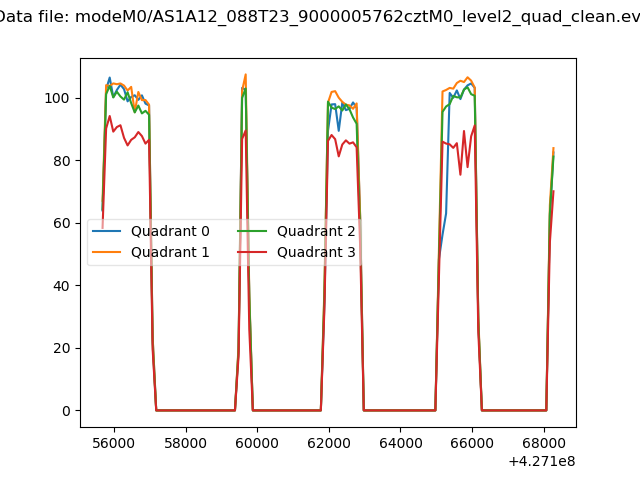
| Quadrant-wise count rates Data is divided into 100 sec bins |
 |
|
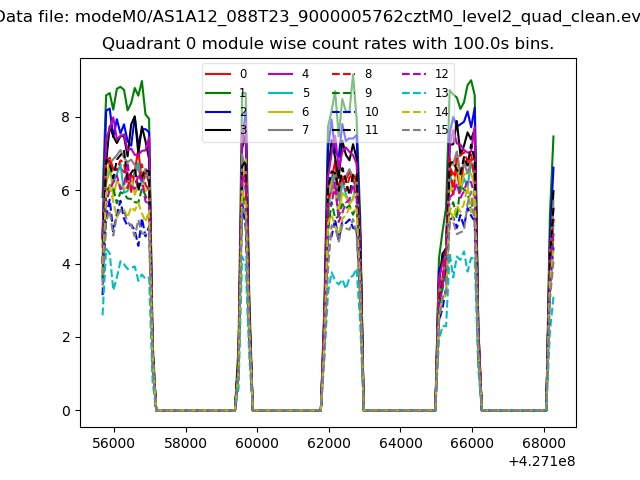
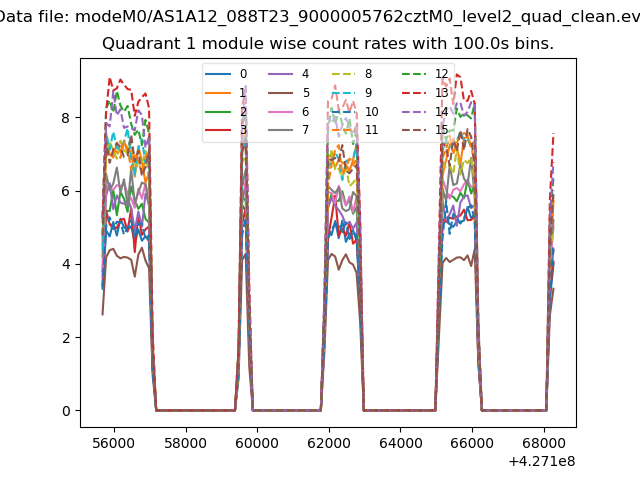
| Module-wise count rates for Quadrant A Data is divided into 100 sec bins |
 |
 |
| Module-wise count rates for Quadrant B Data is divided into 100 sec bins |
 |
 |
| Module-wise count rates for Quadrant C Data is divided into 100 sec bins |
 |
 |
| Module-wise count rates for Quadrant D Data is divided into 100 sec bins |
 |
 |
| Parameter | Plot |
|---|---|
| CZT HV Monitor | 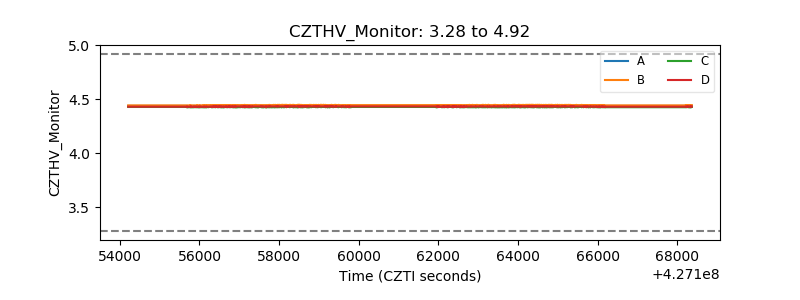 |
| D_VDD | 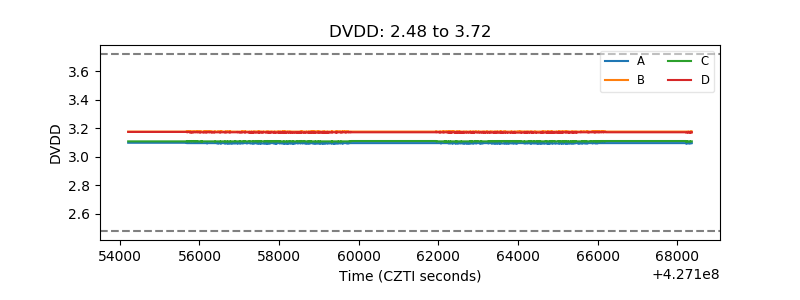 |
| Temperature 1 | 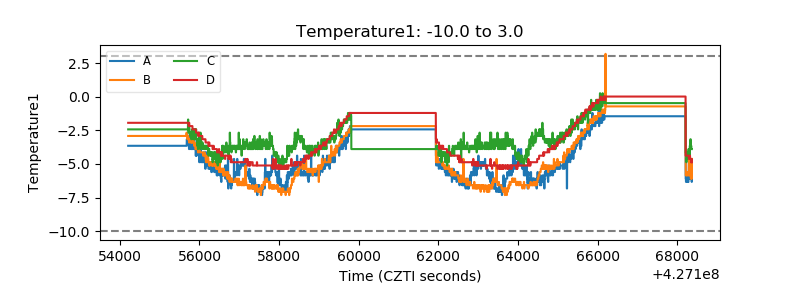 |
| Veto HV Monitor | 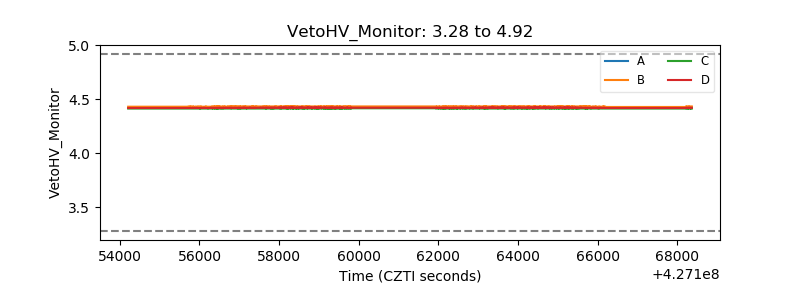 |
| Veto LLD | 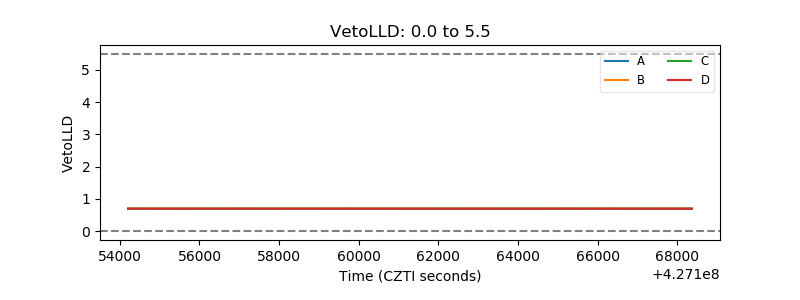 |
| Alpha Counter | 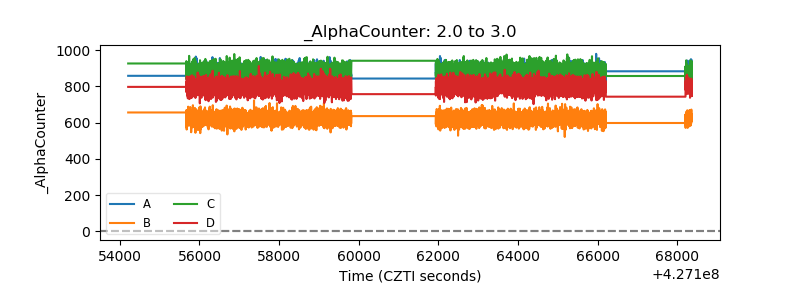 |
| _CPM_Rate | 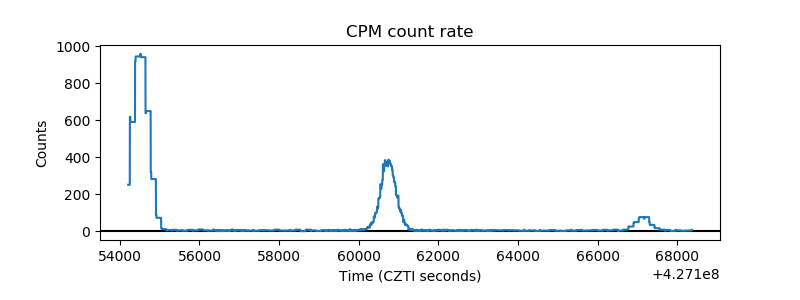 |
| CZT Counter | 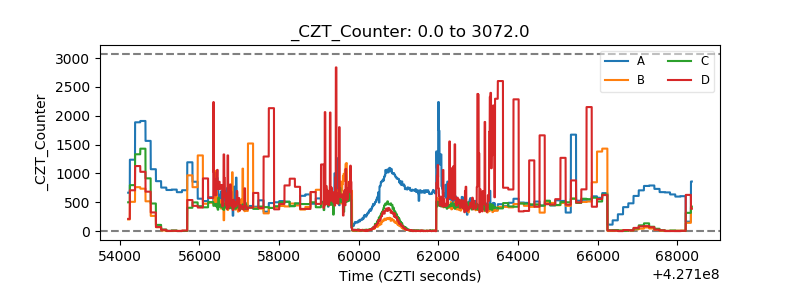 |
| +2.5 Volts monitor | 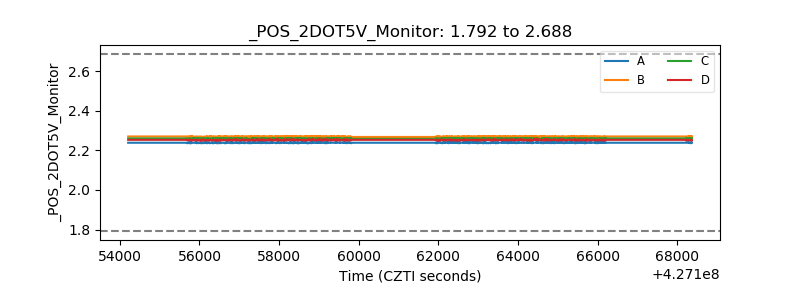 |
| +5 Volts monitor | 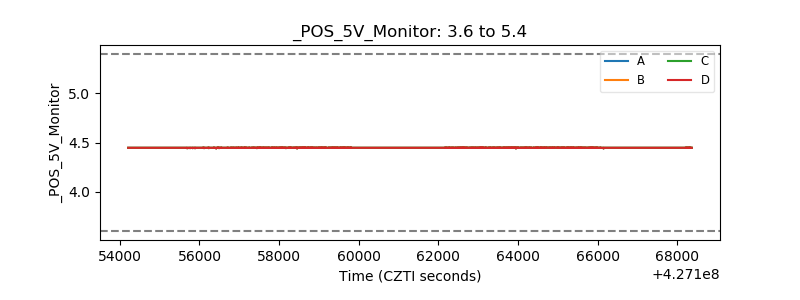 |
| _ROLL_ROT | 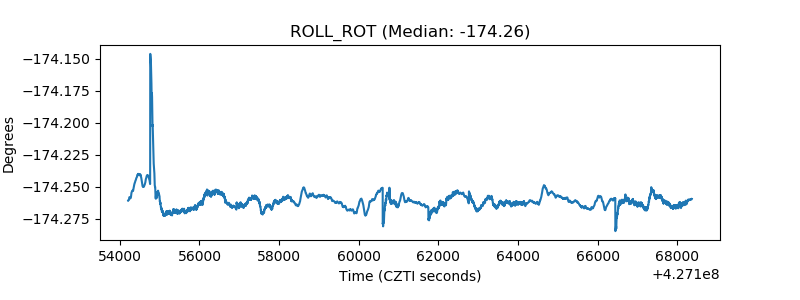 |
| _Roll_DEC | 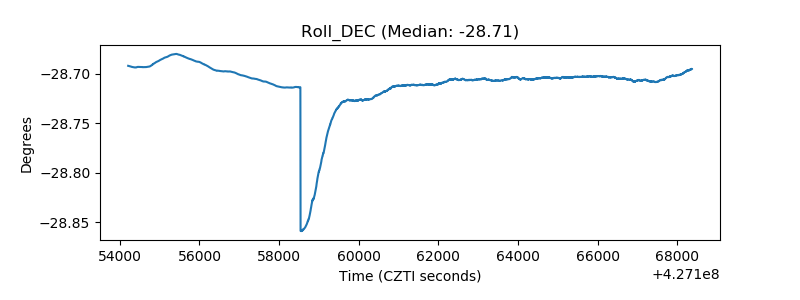 |
| _Roll_RA | 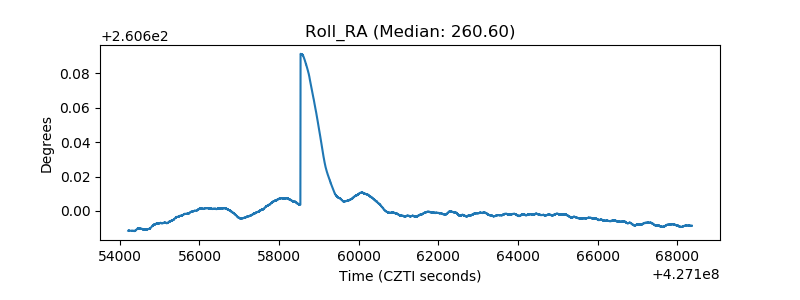 |
| Veto Counter | 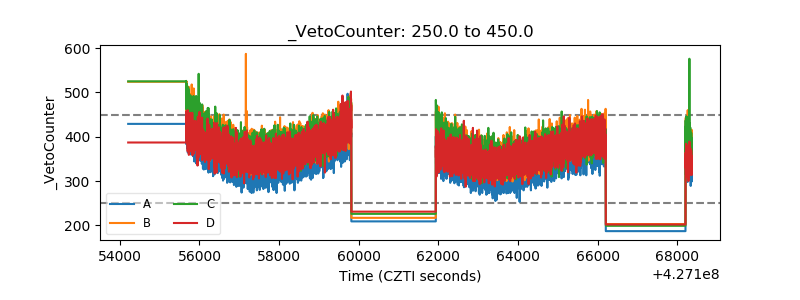 |