| Param | Original file | Final file |
|---|---|---|
| Filename | modeM0/AS1A12_088T21_9000005764cztM0_level2.fits | modeM0/AS1A12_088T21_9000005764cztM0_level2_quad_clean.evt |
| Size (bytes) | 193,207,680 | 212,780,160 |
| Size | 184.3 MB | 202.9 MB |
| Events in quadrant A | 1,130,474 | 1,269,839 |
| Events in quadrant B | 1,103,912 | 1,292,815 |
| Events in quadrant C | 1,132,828 | 1,246,933 |
| Events in quadrant D | 941,924 | 1,092,571 |
| Mode M0 | |||
|---|---|---|---|
| Quadrant | BADHDUFLAG | Total packets | Discarded packets |
| A | 0 | 55241 | 0 |
| B | 0 | 47439 | 0 |
| C | 0 | 44979 | 0 |
| D | 0 | 71925 | 0 |
| Mode M9 | |||
|---|---|---|---|
| Quadrant | BADHDUFLAG | Total packets | Discarded packets |
| A | 0 | 57 | 0 |
| B | 0 | 57 | 0 |
| C | 0 | 57 | 0 |
| D | 0 | 57 | 0 |
| Mode SS | |||
|---|---|---|---|
| Quadrant | BADHDUFLAG | Total packets | Discarded packets |
| A | 0 | 454 | 0 |
| B | 0 | 454 | 0 |
| C | 0 | 454 | 0 |
| D | 0 | 454 | 0 |
| Quadrant | Total seconds | Saturated seconds | Saturation percentage |
|---|---|---|---|
| A | 22401 | 553 | 2.468640% |
| B | 22401 | 173 | 0.772287% |
| C | 22401 | 10 | 0.044641% |
| D | 22401 | 1556 | 6.946118% |
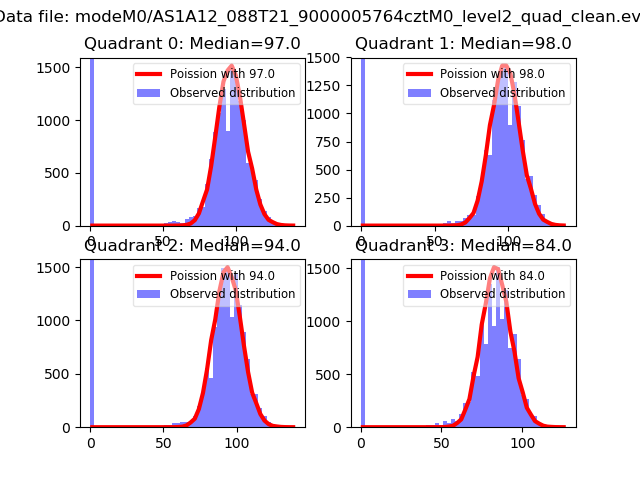
Noise dominated data is calculated using 1-second bins in cleaned event files. If a bin has >2000 counts, and if more than 50% of those come from <1% of pixels, then it is considered to be noise-dominated and hence unusable.
| Quadrant | # 1 sec bins | Bins with >0 counts | Bins with >2000 counts | High rate bins dominated by noise | Noise dominated (total time) | Noise dominated (detector-on time) | Marked lightcurve |
|---|---|---|---|---|---|---|---|
| A | 28072 | 22398 | 0 | 0 | 0.00% | 0.00% |  |
| B | 28072 | 22400 | 0 | 0 | 0.00% | 0.00% |  |
| C | 28072 | 22401 | 0 | 0 | 0.00% | 0.00% |  |
| D | 28072 | 22383 | 0 | 0 | 0.00% | 0.00% | 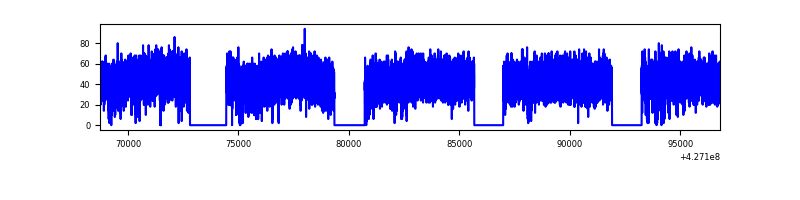 |
Top three noisy pixels from each quadrant. If the there are fewer than three noisy pixels in the level2.evt file, extra rows are filled as -1
| Pixel properties | Quadrant properties | ||||||
|---|---|---|---|---|---|---|---|
| Quadrant | DetID | PixID | Counts | Sigma | Mean | Median | Sigma |
| A | 9 | 19 | 946 | 8.77 | 294 | 275 | 76.5 |
| A | 7 | 110 | 882 | 7.93 | 294 | 275 | 76.5 |
| A | 0 | 29 | 877 | 7.87 | 294 | 275 | 76.5 |
| B | 2 | 9 | 916 | 10.75 | 291 | 277 | 59.4 |
| B | 3 | 80 | 836 | 9.41 | 291 | 277 | 59.4 |
| B | 2 | 8 | 793 | 8.68 | 291 | 277 | 59.4 |
| C | 1 | 81 | 922 | 8.21 | 299 | 279 | 78.4 |
| C | 1 | 80 | 881 | 7.68 | 299 | 279 | 78.4 |
| C | 3 | 202 | 843 | 7.2 | 299 | 279 | 78.4 |
| D | 10 | 113 | 720 | 6.43 | 270 | 246 | 73.7 |
| D | 7 | 3 | 693 | 6.06 | 270 | 246 | 73.7 |
| D | 6 | 231 | 675 | 5.82 | 270 | 246 | 73.7 |
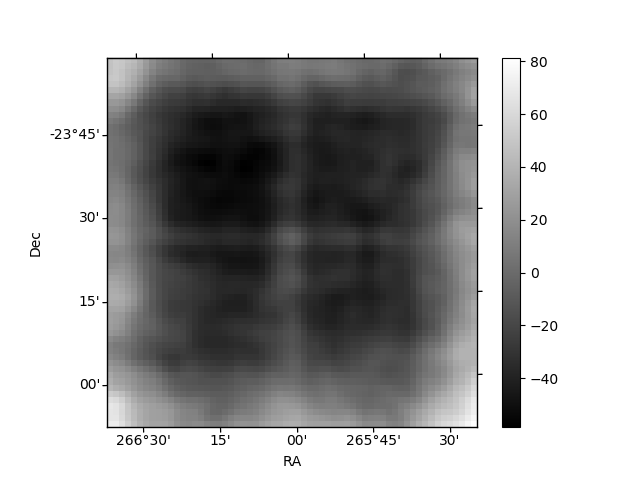
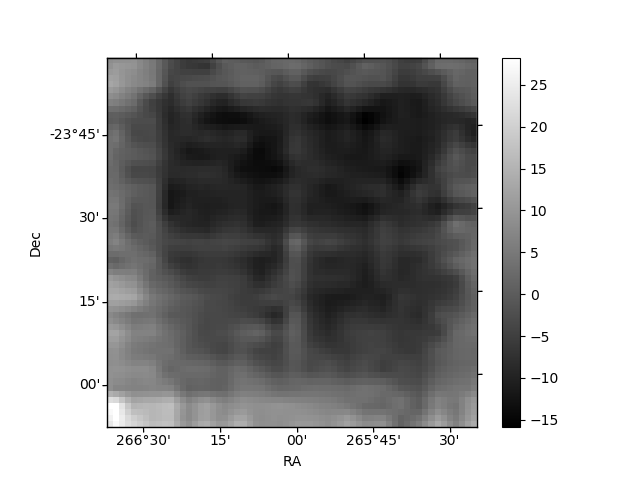
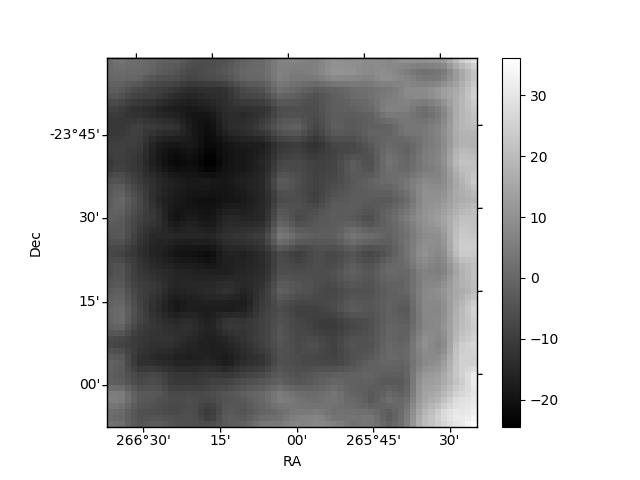
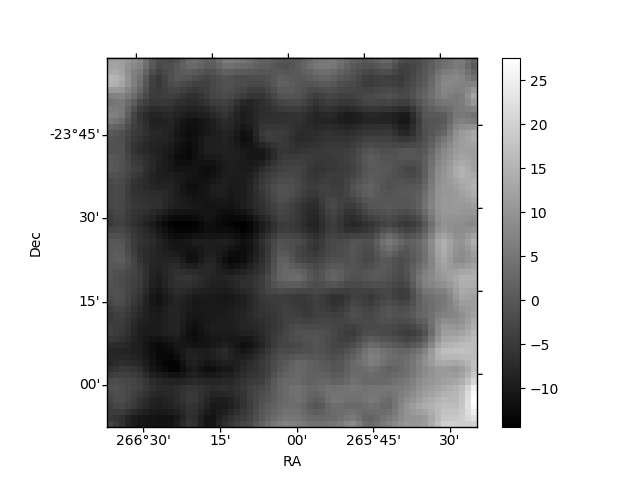
Histogram calculated using DETX and DETY for each event in the final _common_clean file
| Quadrant A | 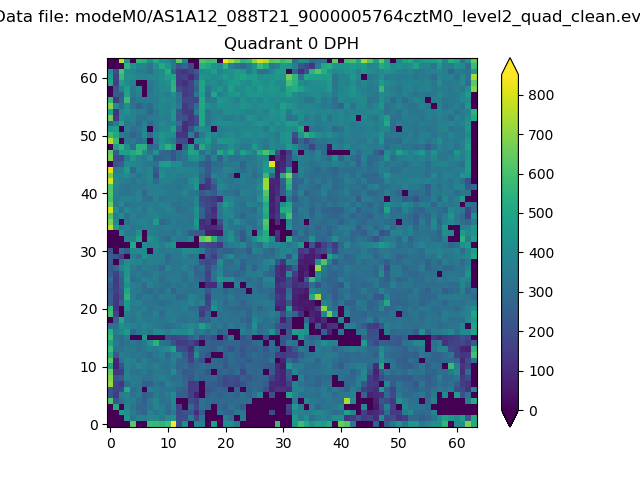 |
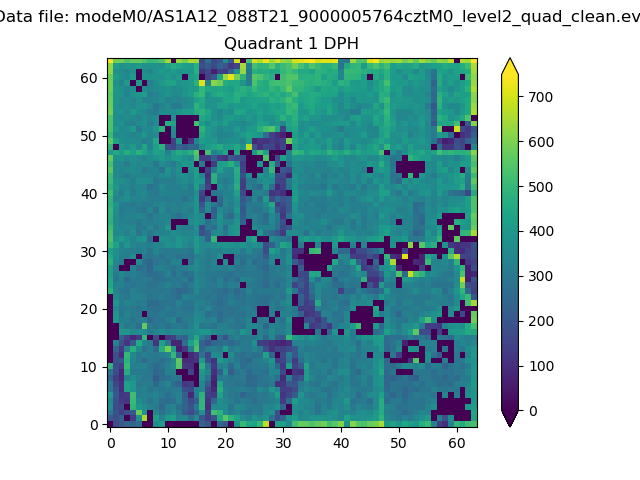 |
Quadrant B |
|---|---|---|---|
| Quadrant D |  |
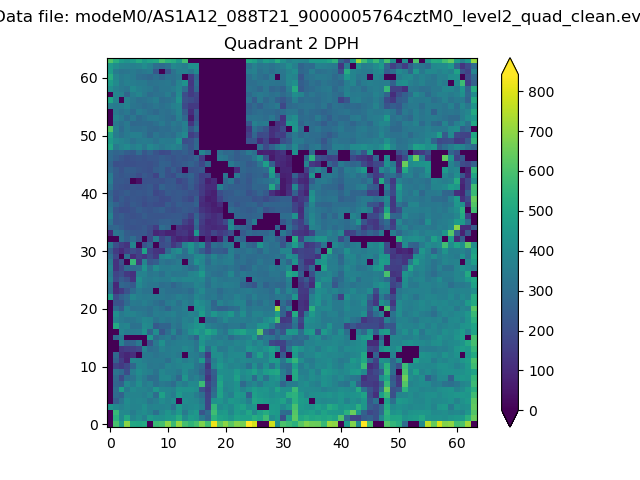 |
Quadrant C |
| Plot type | Count rate plots | Images |
|---|---|---|
| Comparison with Poisson distribution Blue bars denote a histogram of data divided into 1 sec bins. Red curve is a Poisson curve with rate = median count rate of data. |
 |
 |
| Quadrant-wise count rates Data is divided into 100 sec bins |
 |
|
| Module-wise count rates for Quadrant A Data is divided into 100 sec bins |
 |
 |
| Module-wise count rates for Quadrant B Data is divided into 100 sec bins |
 |
 |
| Module-wise count rates for Quadrant C Data is divided into 100 sec bins |
 |
 |
| Module-wise count rates for Quadrant D Data is divided into 100 sec bins |
 |
 |
| Parameter | Plot |
|---|---|
| CZT HV Monitor | 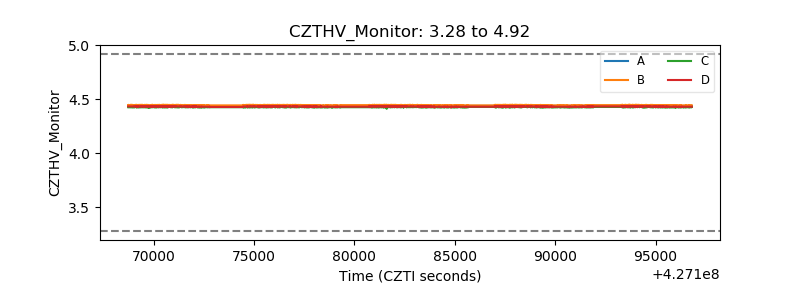 |
| D_VDD | 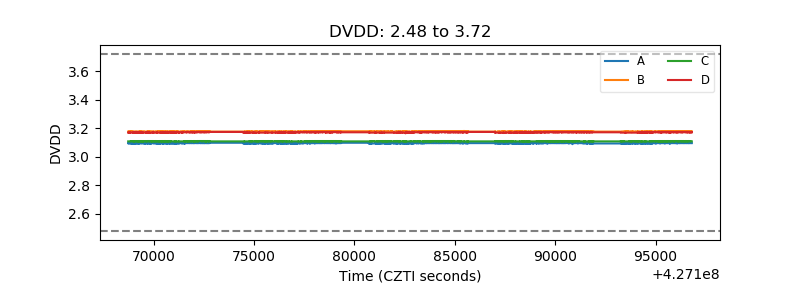 |
| Temperature 1 |  |
| Veto HV Monitor |  |
| Veto LLD | 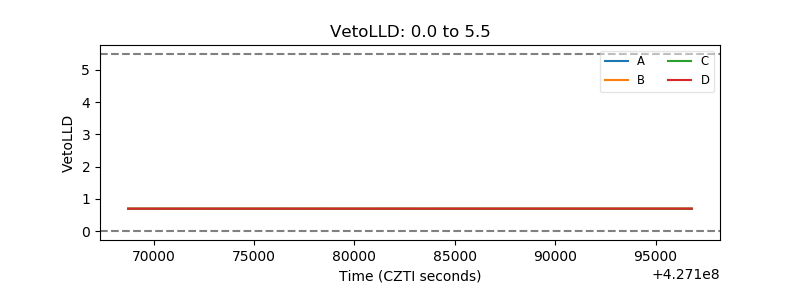 |
| Alpha Counter |  |
| _CPM_Rate | 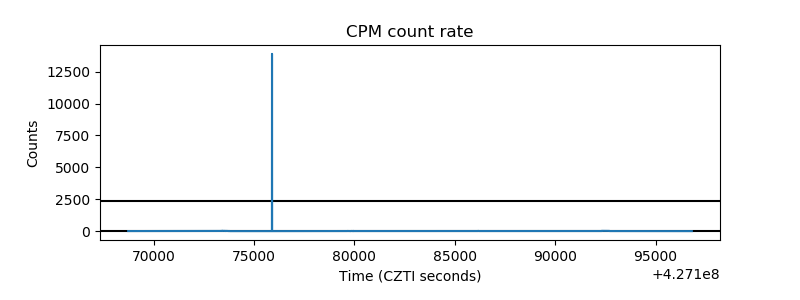 |
| CZT Counter | 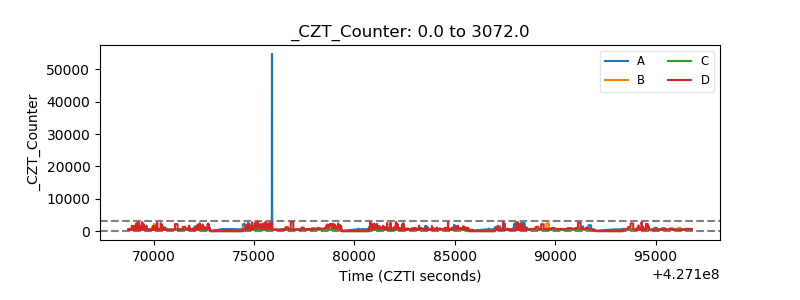 |
| +2.5 Volts monitor |  |
| +5 Volts monitor | 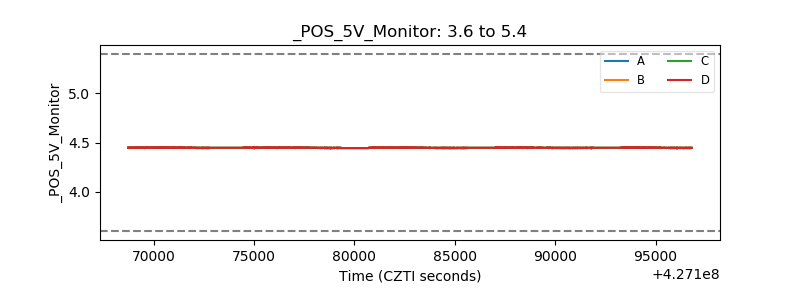 |
| _ROLL_ROT |  |
| _Roll_DEC |  |
| _Roll_RA | 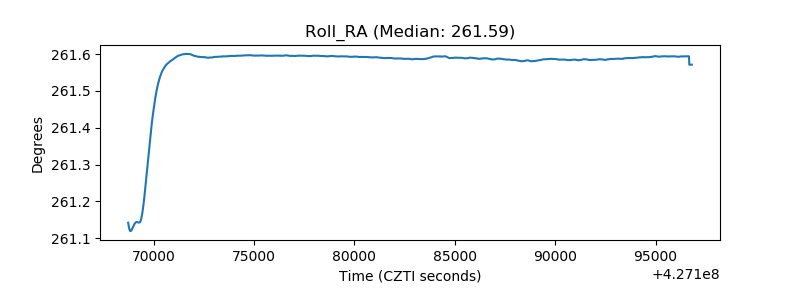 |
| Veto Counter |  |