| Param | Original file | Final file |
|---|---|---|
| Filename | modeM0/AS1A12_088T24_9000005768cztM0_level2.fits | modeM0/AS1A12_088T24_9000005768cztM0_level2_quad_clean.evt |
| Size (bytes) | 211,357,440 | 182,989,440 |
| Size | 201.6 MB | 174.5 MB |
| Events in quadrant A | 1,241,738 | 959,692 |
| Events in quadrant B | 1,230,652 | 1,062,423 |
| Events in quadrant C | 1,245,480 | 1,004,861 |
| Events in quadrant D | 1,057,444 | 888,568 |
| Mode M0 | |||
|---|---|---|---|
| Quadrant | BADHDUFLAG | Total packets | Discarded packets |
| A | 0 | 62860 | 0 |
| B | 0 | 49136 | 0 |
| C | 0 | 48512 | 0 |
| D | 0 | 58894 | 0 |
| Mode M9 | |||
|---|---|---|---|
| Quadrant | BADHDUFLAG | Total packets | Discarded packets |
| A | 0 | 99 | 0 |
| B | 0 | 99 | 0 |
| C | 0 | 99 | 0 |
| D | 0 | 99 | 0 |
| Mode SS | |||
|---|---|---|---|
| Quadrant | BADHDUFLAG | Total packets | Discarded packets |
| A | 0 | 484 | 0 |
| B | 0 | 484 | 0 |
| C | 0 | 484 | 0 |
| D | 0 | 484 | 0 |
| Quadrant | Total seconds | Saturated seconds | Saturation percentage |
|---|---|---|---|
| A | 23613 | 1064 | 4.505992% |
| B | 23613 | 62 | 0.262567% |
| C | 23613 | 73 | 0.309152% |
| D | 23613 | 755 | 3.197391% |
Noise dominated data is calculated using 1-second bins in cleaned event files. If a bin has >2000 counts, and if more than 50% of those come from <1% of pixels, then it is considered to be noise-dominated and hence unusable.
| Quadrant | # 1 sec bins | Bins with >0 counts | Bins with >2000 counts | High rate bins dominated by noise | Noise dominated (total time) | Noise dominated (detector-on time) | Marked lightcurve |
|---|---|---|---|---|---|---|---|
| A | 33567 | 23607 | 0 | 0 | 0.00% | 0.00% |  |
| B | 33567 | 23613 | 0 | 0 | 0.00% | 0.00% |  |
| C | 33567 | 23613 | 0 | 0 | 0.00% | 0.00% |  |
| D | 33567 | 23546 | 0 | 0 | 0.00% | 0.00% |  |
Top three noisy pixels from each quadrant. If the there are fewer than three noisy pixels in the level2.evt file, extra rows are filled as -1
| Pixel properties | Quadrant properties | ||||||
|---|---|---|---|---|---|---|---|
| Quadrant | DetID | PixID | Counts | Sigma | Mean | Median | Sigma |
| A | 7 | 110 | 1038 | 8.88 | 323 | 303 | 82.8 |
| A | 0 | 29 | 1030 | 8.78 | 323 | 303 | 82.8 |
| A | 9 | 19 | 970 | 8.06 | 323 | 303 | 82.8 |
| B | 2 | 9 | 1043 | 11.16 | 325 | 310 | 65.7 |
| B | 3 | 80 | 922 | 9.32 | 325 | 310 | 65.7 |
| B | 5 | 128 | 921 | 9.31 | 325 | 310 | 65.7 |
| C | 1 | 81 | 1009 | 8.12 | 329 | 308 | 86.3 |
| C | 1 | 80 | 953 | 7.47 | 329 | 308 | 86.3 |
| C | 3 | 203 | 945 | 7.38 | 329 | 308 | 86.3 |
| D | 4 | 160 | 792 | 6.22 | 302 | 275 | 83.1 |
| D | 10 | 113 | 790 | 6.2 | 302 | 275 | 83.1 |
| D | 7 | 3 | 782 | 6.1 | 302 | 275 | 83.1 |
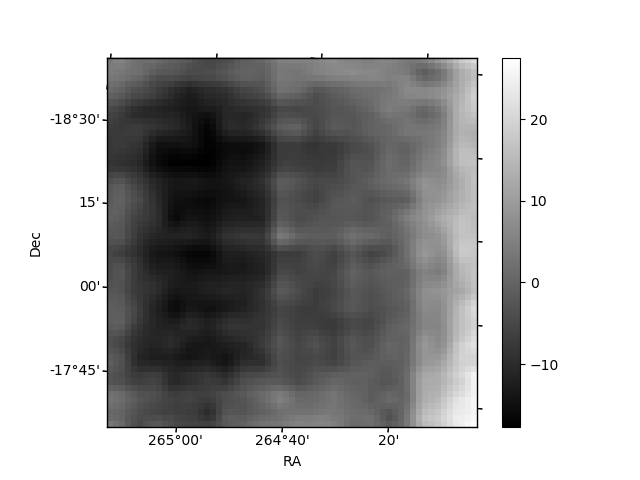
Histogram calculated using DETX and DETY for each event in the final _common_clean file
| Quadrant A | 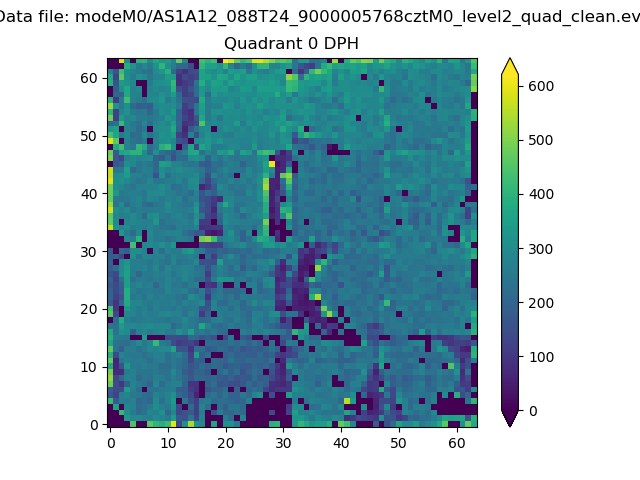 |
 |
Quadrant B |
|---|---|---|---|
| Quadrant D | 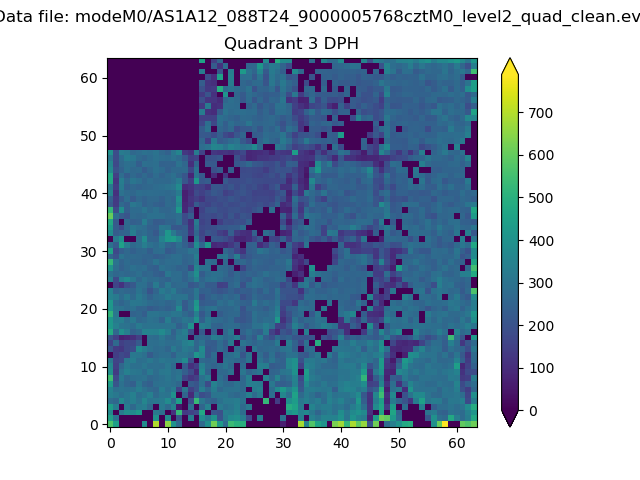 |
 |
Quadrant C |
| Plot type | Count rate plots | Images |
|---|---|---|
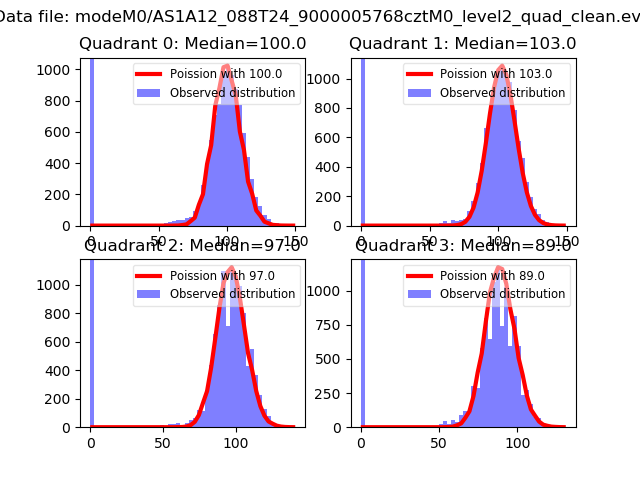
| Comparison with Poisson distribution Blue bars denote a histogram of data divided into 1 sec bins. Red curve is a Poisson curve with rate = median count rate of data. |
 |
 |
| Quadrant-wise count rates Data is divided into 100 sec bins |
 |
|
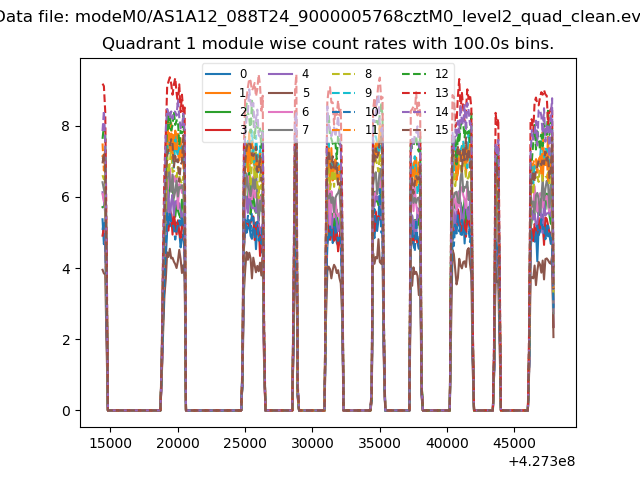
| Module-wise count rates for Quadrant A Data is divided into 100 sec bins |
 |
 |
| Module-wise count rates for Quadrant B Data is divided into 100 sec bins |
 |
 |
| Module-wise count rates for Quadrant C Data is divided into 100 sec bins |
 |
 |
| Module-wise count rates for Quadrant D Data is divided into 100 sec bins |
 |
 |
| Parameter | Plot |
|---|---|
| CZT HV Monitor |  |
| D_VDD |  |
| Temperature 1 |  |
| Veto HV Monitor |  |
| Veto LLD |  |
| Alpha Counter |  |
| _CPM_Rate | 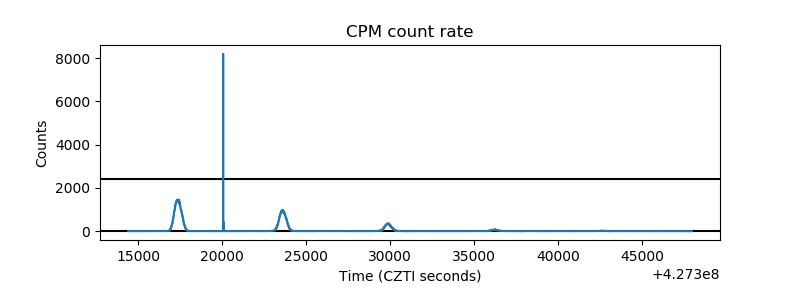 |
| CZT Counter |  |
| +2.5 Volts monitor |  |
| +5 Volts monitor |  |
| _ROLL_ROT | 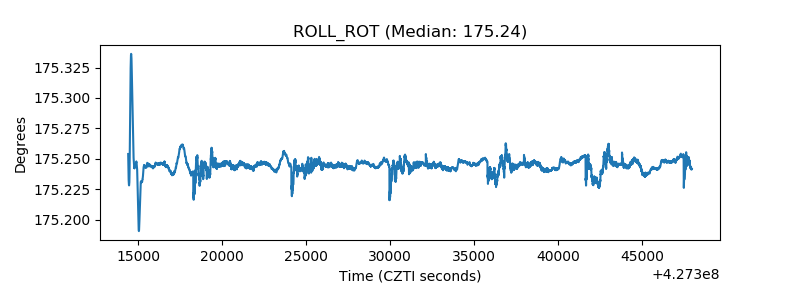 |
| _Roll_DEC |  |
| _Roll_RA |  |
| Veto Counter |  |