| Param | Original file | Final file |
|---|---|---|
| Filename | modeM0/AS1A12_088T25_9000005770cztM0_level2.fits | modeM0/AS1A12_088T25_9000005770cztM0_level2_quad_clean.evt |
| Size (bytes) | 155,724,480 | 180,383,040 |
| Size | 148.5 MB | 172.0 MB |
| Events in quadrant A | 916,362 | 1,086,371 |
| Events in quadrant B | 883,286 | 1,120,137 |
| Events in quadrant C | 904,984 | 1,068,236 |
| Events in quadrant D | 777,580 | 953,902 |
| Mode M0 | |||
|---|---|---|---|
| Quadrant | BADHDUFLAG | Total packets | Discarded packets |
| A | 0 | 39608 | 0 |
| B | 0 | 39067 | 0 |
| C | 0 | 35917 | 0 |
| D | 0 | 43757 | 0 |
| Mode M9 | |||
|---|---|---|---|
| Quadrant | BADHDUFLAG | Total packets | Discarded packets |
| A | 0 | 53 | 0 |
| B | 0 | 53 | 0 |
| C | 0 | 53 | 0 |
| D | 0 | 53 | 0 |
| Mode SS | |||
|---|---|---|---|
| Quadrant | BADHDUFLAG | Total packets | Discarded packets |
| A | 0 | 368 | 0 |
| B | 0 | 368 | 0 |
| C | 0 | 368 | 0 |
| D | 0 | 368 | 0 |
| Quadrant | Total seconds | Saturated seconds | Saturation percentage |
|---|---|---|---|
| A | 17897 | 197 | 1.100743% |
| B | 17897 | 151 | 0.843717% |
| C | 17897 | 12 | 0.067050% |
| D | 17895 | 459 | 2.564962% |
Noise dominated data is calculated using 1-second bins in cleaned event files. If a bin has >2000 counts, and if more than 50% of those come from <1% of pixels, then it is considered to be noise-dominated and hence unusable.
| Quadrant | # 1 sec bins | Bins with >0 counts | Bins with >2000 counts | High rate bins dominated by noise | Noise dominated (total time) | Noise dominated (detector-on time) | Marked lightcurve |
|---|---|---|---|---|---|---|---|
| A | 23299 | 17896 | 0 | 0 | 0.00% | 0.00% |  |
| B | 23299 | 17897 | 0 | 0 | 0.00% | 0.00% |  |
| C | 23299 | 17897 | 0 | 0 | 0.00% | 0.00% |  |
| D | 23299 | 17885 | 0 | 0 | 0.00% | 0.00% |  |
Top three noisy pixels from each quadrant. If the there are fewer than three noisy pixels in the level2.evt file, extra rows are filled as -1
| Pixel properties | Quadrant properties | ||||||
|---|---|---|---|---|---|---|---|
| Quadrant | DetID | PixID | Counts | Sigma | Mean | Median | Sigma |
| A | 7 | 110 | 813 | 9.48 | 238 | 223 | 62.3 |
| A | 0 | 29 | 775 | 8.86 | 238 | 223 | 62.3 |
| A | 9 | 19 | 760 | 8.62 | 238 | 223 | 62.3 |
| B | 2 | 9 | 761 | 11.41 | 233 | 222 | 47.2 |
| B | 3 | 80 | 654 | 9.14 | 233 | 222 | 47.2 |
| B | 5 | 128 | 653 | 9.12 | 233 | 222 | 47.2 |
| C | 3 | 203 | 699 | 7.65 | 238 | 223 | 62.2 |
| C | 3 | 202 | 695 | 7.58 | 238 | 223 | 62.2 |
| C | 3 | 187 | 652 | 6.89 | 238 | 223 | 62.2 |
| D | 7 | 3 | 589 | 6.4 | 221 | 200 | 60.8 |
| D | 10 | 189 | 586 | 6.35 | 221 | 200 | 60.8 |
| D | 3 | 14 | 566 | 6.02 | 221 | 200 | 60.8 |
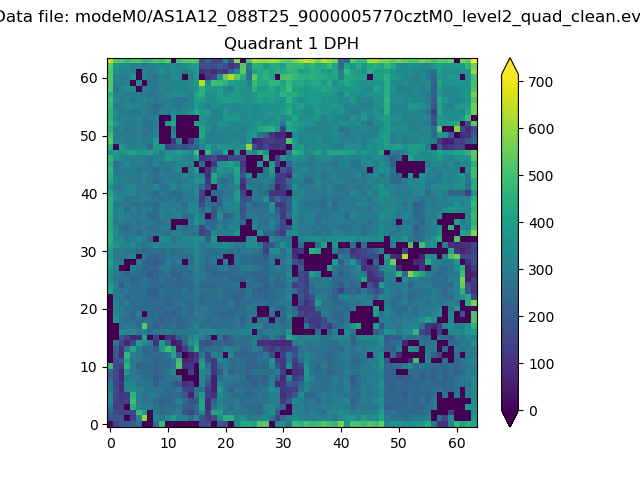
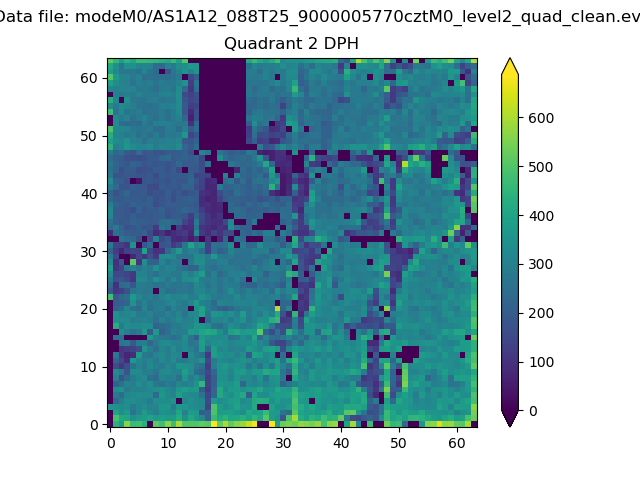
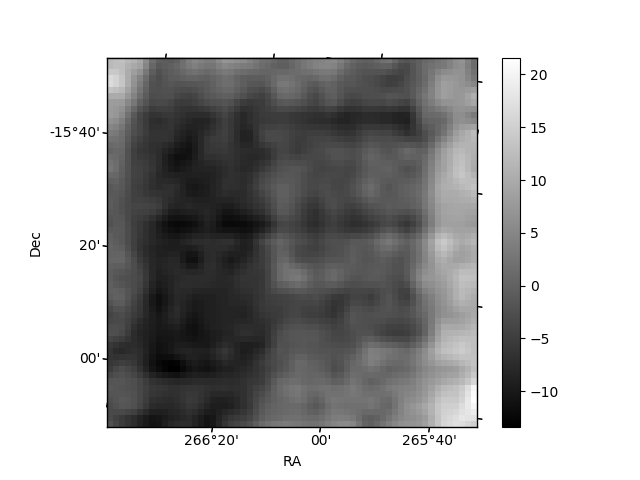
Histogram calculated using DETX and DETY for each event in the final _common_clean file
| Quadrant A |  |
 |
Quadrant B |
|---|---|---|---|
| Quadrant D | 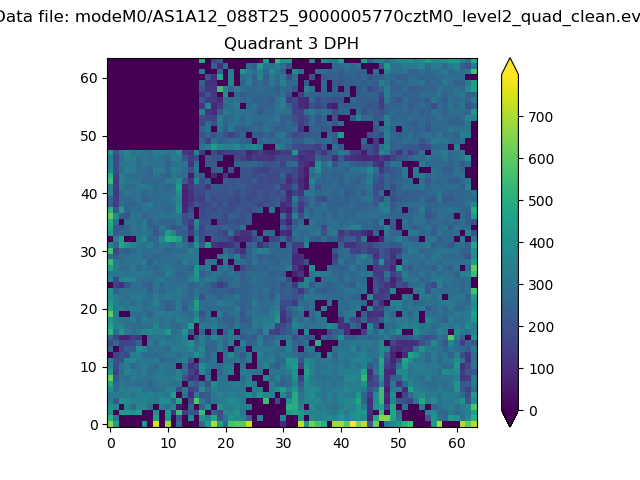 |
 |
Quadrant C |
| Plot type | Count rate plots | Images |
|---|---|---|
| Comparison with Poisson distribution Blue bars denote a histogram of data divided into 1 sec bins. Red curve is a Poisson curve with rate = median count rate of data. |
 |
 |
| Quadrant-wise count rates Data is divided into 100 sec bins |
 |
|
| Module-wise count rates for Quadrant A Data is divided into 100 sec bins |
 |
 |
| Module-wise count rates for Quadrant B Data is divided into 100 sec bins |
 |
 |
| Module-wise count rates for Quadrant C Data is divided into 100 sec bins |
 |
 |
| Module-wise count rates for Quadrant D Data is divided into 100 sec bins |
 |
 |
| Parameter | Plot |
|---|---|
| CZT HV Monitor |  |
| D_VDD |  |
| Temperature 1 |  |
| Veto HV Monitor |  |
| Veto LLD |  |
| Alpha Counter |  |
| _CPM_Rate | 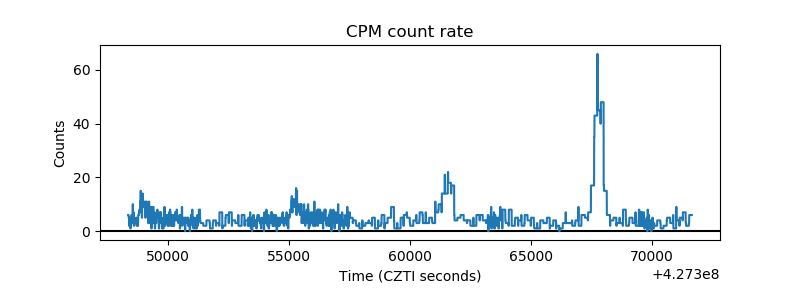 |
| CZT Counter | 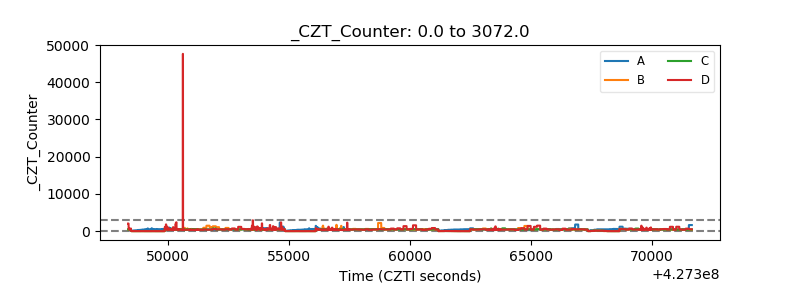 |
| +2.5 Volts monitor | 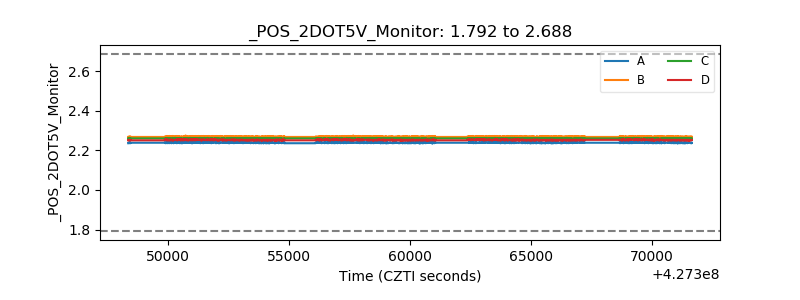 |
| +5 Volts monitor | 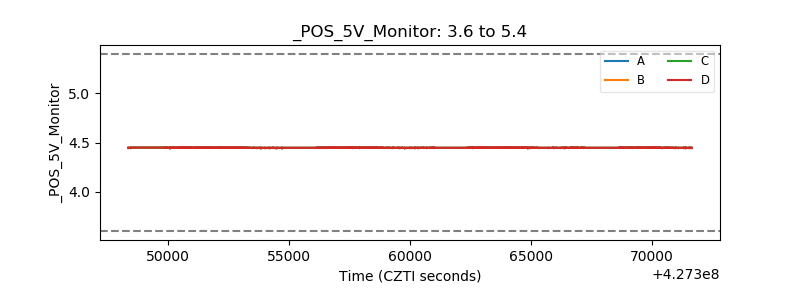 |
| _ROLL_ROT |  |
| _Roll_DEC |  |
| _Roll_RA |  |
| Veto Counter |  |