| Param | Original file | Final file |
|---|---|---|
| Filename | modeM0/AS1A12_088T58_9000005772cztM0_level2.fits | modeM0/AS1A12_088T58_9000005772cztM0_level2_quad_clean.evt |
| Size (bytes) | 77,388,480 | 92,459,520 |
| Size | 73.8 MB | 88.2 MB |
| Events in quadrant A | 463,600 | 575,389 |
| Events in quadrant B | 443,996 | 578,009 |
| Events in quadrant C | 452,296 | 558,832 |
| Events in quadrant D | 387,574 | 490,890 |
| Mode M0 | |||
|---|---|---|---|
| Quadrant | BADHDUFLAG | Total packets | Discarded packets |
| A | 0 | 19219 | 0 |
| B | 0 | 18247 | 0 |
| C | 0 | 17547 | 0 |
| D | 0 | 22880 | 0 |
| Mode M9 | |||
|---|---|---|---|
| Quadrant | BADHDUFLAG | Total packets | Discarded packets |
| A | 0 | 38 | 0 |
| B | 0 | 39 | 0 |
| C | 0 | 39 | 0 |
| D | 0 | 39 | 0 |
| Mode SS | |||
|---|---|---|---|
| Quadrant | BADHDUFLAG | Total packets | Discarded packets |
| A | 0 | 176 | 0 |
| B | 0 | 176 | 0 |
| C | 0 | 176 | 0 |
| D | 0 | 176 | 0 |
| Quadrant | Total seconds | Saturated seconds | Saturation percentage |
|---|---|---|---|
| A | 8590 | 36 | 0.419092% |
| B | 8588 | 38 | 0.442478% |
| C | 8590 | 4 | 0.046566% |
| D | 8590 | 294 | 3.422584% |
Noise dominated data is calculated using 1-second bins in cleaned event files. If a bin has >2000 counts, and if more than 50% of those come from <1% of pixels, then it is considered to be noise-dominated and hence unusable.
| Quadrant | # 1 sec bins | Bins with >0 counts | Bins with >2000 counts | High rate bins dominated by noise | Noise dominated (total time) | Noise dominated (detector-on time) | Marked lightcurve |
|---|---|---|---|---|---|---|---|
| A | 17131 | 8591 | 0 | 0 | 0.00% | 0.00% | 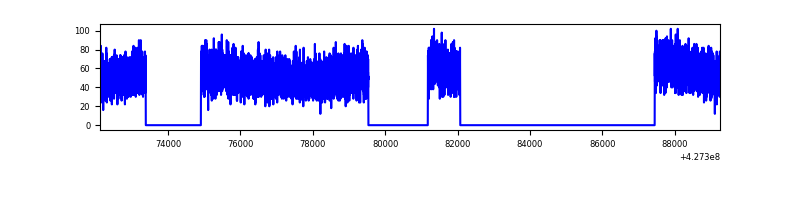 |
| B | 17131 | 8588 | 0 | 0 | 0.00% | 0.00% |  |
| C | 17131 | 8590 | 0 | 0 | 0.00% | 0.00% |  |
| D | 17131 | 8590 | 0 | 0 | 0.00% | 0.00% |  |
Top three noisy pixels from each quadrant. If the there are fewer than three noisy pixels in the level2.evt file, extra rows are filled as -1
| Pixel properties | Quadrant properties | ||||||
|---|---|---|---|---|---|---|---|
| Quadrant | DetID | PixID | Counts | Sigma | Mean | Median | Sigma |
| A | 9 | 19 | 400 | 8.8 | 121 | 114 | 32.5 |
| A | 0 | 29 | 368 | 7.81 | 121 | 114 | 32.5 |
| A | 7 | 110 | 366 | 7.75 | 121 | 114 | 32.5 |
| B | 2 | 9 | 372 | 10.06 | 117 | 112 | 25.9 |
| B | 3 | 80 | 344 | 8.97 | 117 | 112 | 25.9 |
| B | 2 | 8 | 300 | 7.27 | 117 | 112 | 25.9 |
| C | 1 | 81 | 380 | 8.17 | 119 | 112 | 32.8 |
| C | 1 | 80 | 378 | 8.11 | 119 | 112 | 32.8 |
| C | 1 | 65 | 316 | 6.22 | 119 | 112 | 32.8 |
| D | 7 | 3 | 313 | 6.79 | 110 | 100 | 31.4 |
| D | 4 | 160 | 296 | 6.25 | 110 | 100 | 31.4 |
| D | 6 | 67 | 295 | 6.22 | 110 | 100 | 31.4 |
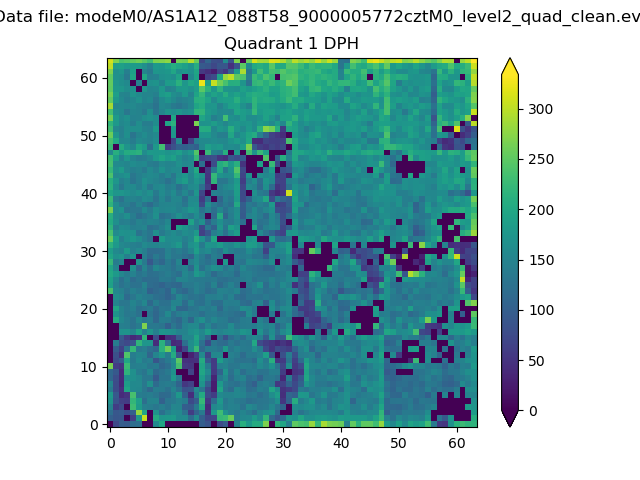
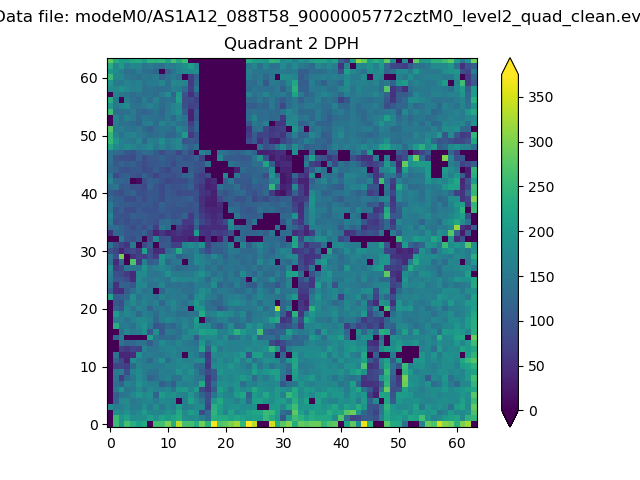
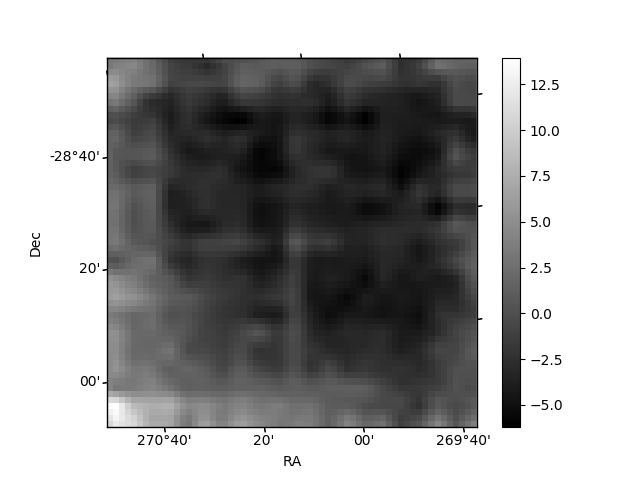
Histogram calculated using DETX and DETY for each event in the final _common_clean file
| Quadrant A |  |
 |
Quadrant B |
|---|---|---|---|
| Quadrant D | 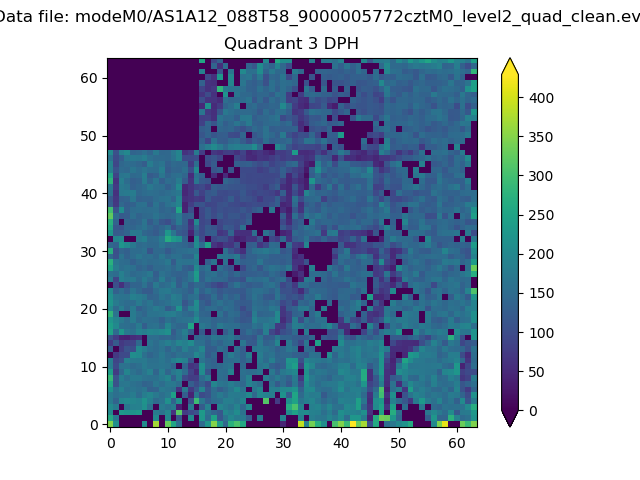 |
 |
Quadrant C |
| Plot type | Count rate plots | Images |
|---|---|---|
| Comparison with Poisson distribution Blue bars denote a histogram of data divided into 1 sec bins. Red curve is a Poisson curve with rate = median count rate of data. |
 |
 |
| Quadrant-wise count rates Data is divided into 100 sec bins |
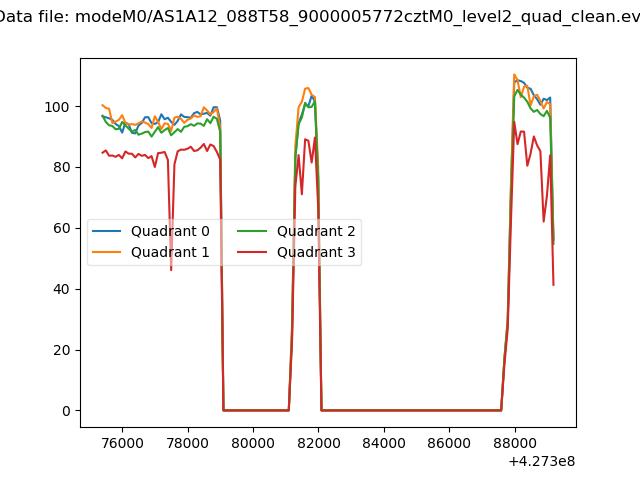 |
|
| Module-wise count rates for Quadrant A Data is divided into 100 sec bins |
 |
 |
| Module-wise count rates for Quadrant B Data is divided into 100 sec bins |
 |
 |
| Module-wise count rates for Quadrant C Data is divided into 100 sec bins |
 |
 |
| Module-wise count rates for Quadrant D Data is divided into 100 sec bins |
 |
 |
| Parameter | Plot |
|---|---|
| CZT HV Monitor | 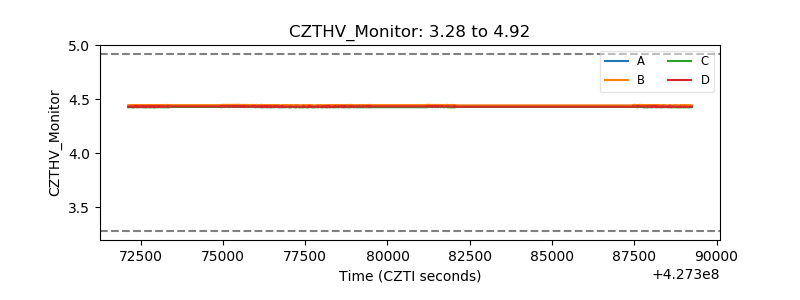 |
| D_VDD | 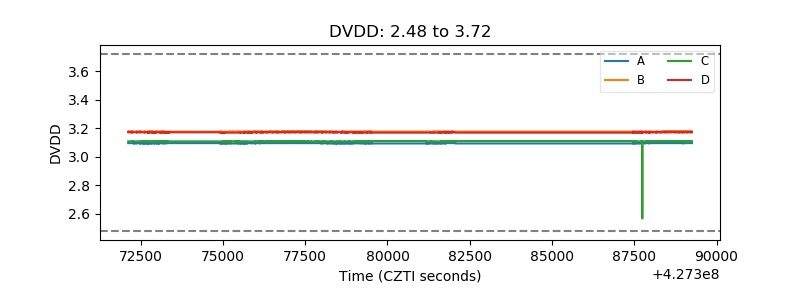 |
| Temperature 1 |  |
| Veto HV Monitor |  |
| Veto LLD | 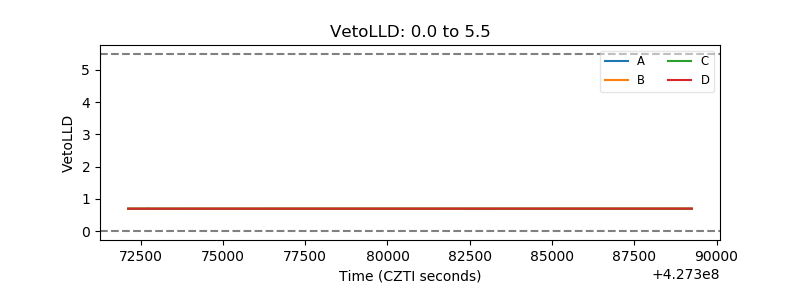 |
| Alpha Counter | 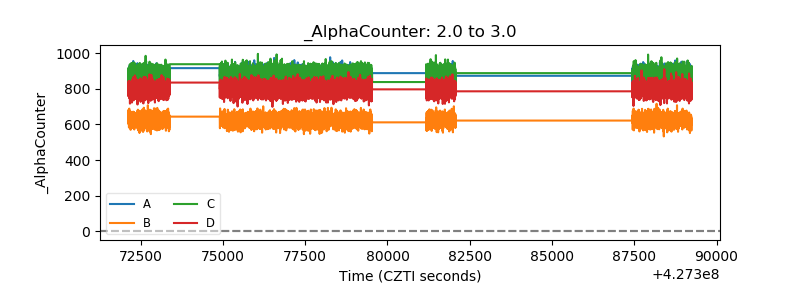 |
| _CPM_Rate | 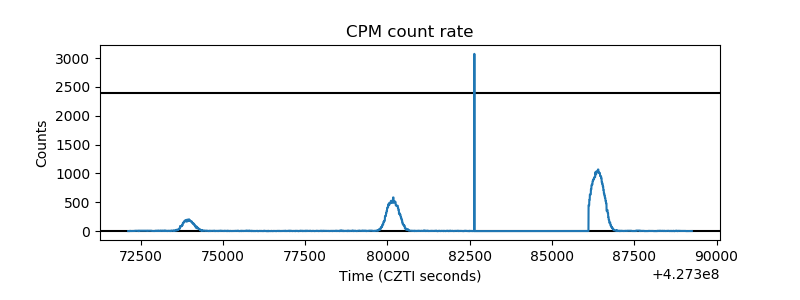 |
| CZT Counter | 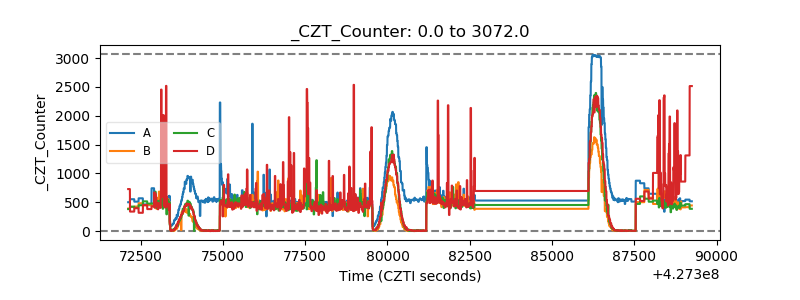 |
| +2.5 Volts monitor |  |
| +5 Volts monitor |  |
| _ROLL_ROT |  |
| _Roll_DEC |  |
| _Roll_RA |  |
| Veto Counter | 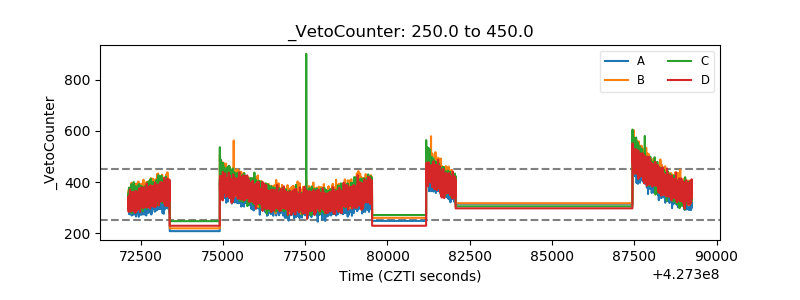 |