| Param | Original file | Final file |
|---|---|---|
| Filename | modeM0/AS1A12_089T01_9000005776cztM0_level2.fits | modeM0/AS1A12_089T01_9000005776cztM0_level2_quad_clean.evt |
| Size (bytes) | 302,814,720 | 297,296,640 |
| Size | 288.8 MB | 283.5 MB |
| Events in quadrant A | 1,797,154 | 1,721,960 |
| Events in quadrant B | 1,720,746 | 1,720,993 |
| Events in quadrant C | 1,769,616 | 1,691,518 |
| Events in quadrant D | 1,506,498 | 1,492,229 |
| Mode SS | |||
|---|---|---|---|
| Quadrant | BADHDUFLAG | Total packets | Discarded packets |
| A | 0 | 706 | 0 |
| B | 0 | 706 | 0 |
| C | 0 | 706 | 0 |
| D | 0 | 706 | 0 |
| Mode M0 | |||
|---|---|---|---|
| Quadrant | BADHDUFLAG | Total packets | Discarded packets |
| A | 0 | 76748 | 0 |
| B | 0 | 76002 | 0 |
| C | 0 | 69608 | 0 |
| D | 0 | 89084 | 0 |
| Mode M9 | |||
|---|---|---|---|
| Quadrant | BADHDUFLAG | Total packets | Discarded packets |
| A | 0 | 115 | 0 |
| B | 0 | 115 | 0 |
| C | 0 | 115 | 0 |
| D | 0 | 115 | 0 |
| Quadrant | Total seconds | Saturated seconds | Saturation percentage |
|---|---|---|---|
| A | 34591 | 311 | 0.899078% |
| B | 34591 | 738 | 2.133503% |
| C | 34591 | 14 | 0.040473% |
| D | 34591 | 1073 | 3.101963% |
Noise dominated data is calculated using 1-second bins in cleaned event files. If a bin has >2000 counts, and if more than 50% of those come from <1% of pixels, then it is considered to be noise-dominated and hence unusable.
| Quadrant | # 1 sec bins | Bins with >0 counts | Bins with >2000 counts | High rate bins dominated by noise | Noise dominated (total time) | Noise dominated (detector-on time) | Marked lightcurve |
|---|---|---|---|---|---|---|---|
| A | 46153 | 34589 | 0 | 0 | 0.00% | 0.00% |  |
| B | 46153 | 34584 | 0 | 0 | 0.00% | 0.00% | 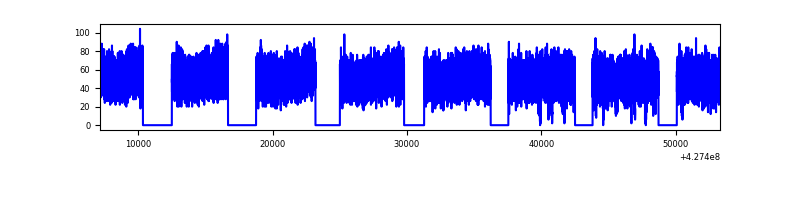 |
| C | 46153 | 34591 | 0 | 0 | 0.00% | 0.00% | 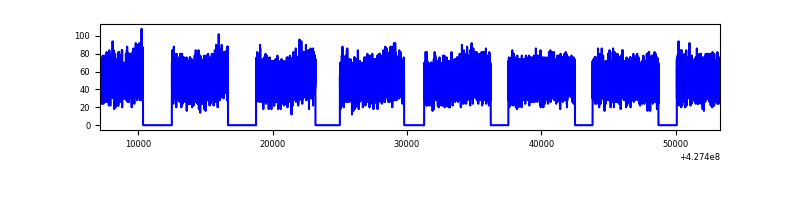 |
| D | 46153 | 34574 | 0 | 0 | 0.00% | 0.00% |  |
Top three noisy pixels from each quadrant. If the there are fewer than three noisy pixels in the level2.evt file, extra rows are filled as -1
| Pixel properties | Quadrant properties | ||||||
|---|---|---|---|---|---|---|---|
| Quadrant | DetID | PixID | Counts | Sigma | Mean | Median | Sigma |
| A | 7 | 110 | 1481 | 8.66 | 468 | 438 | 120.4 |
| A | 9 | 19 | 1464 | 8.52 | 468 | 438 | 120.4 |
| A | 0 | 29 | 1436 | 8.29 | 468 | 438 | 120.4 |
| B | 2 | 9 | 1463 | 11.43 | 454 | 432 | 90.2 |
| B | 3 | 80 | 1249 | 9.06 | 454 | 432 | 90.2 |
| B | 2 | 8 | 1180 | 8.29 | 454 | 432 | 90.2 |
| C | 1 | 81 | 1446 | 8.35 | 467 | 436 | 121.0 |
| C | 1 | 80 | 1396 | 7.93 | 467 | 436 | 121.0 |
| C | 1 | 65 | 1232 | 6.58 | 467 | 436 | 121.0 |
| D | 3 | 14 | 1204 | 6.94 | 430 | 390 | 117.3 |
| D | 7 | 3 | 1104 | 6.09 | 430 | 390 | 117.3 |
| D | 6 | 62 | 1091 | 5.98 | 430 | 390 | 117.3 |
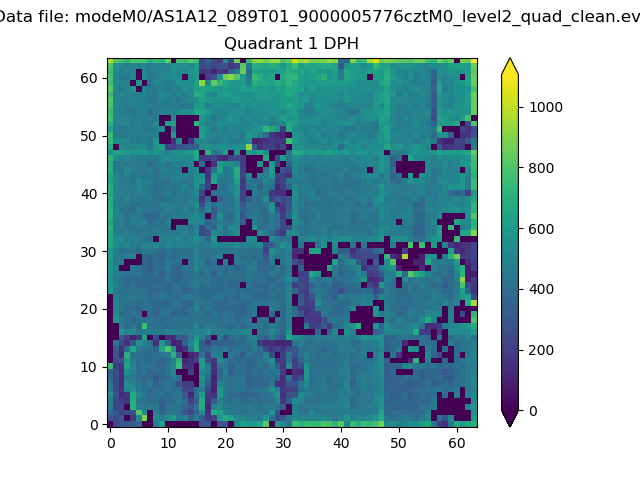
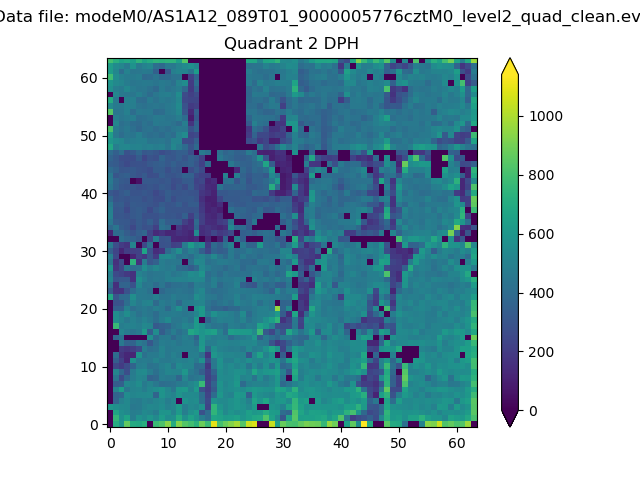
Histogram calculated using DETX and DETY for each event in the final _common_clean file
| Quadrant A |  |
 |
Quadrant B |
|---|---|---|---|
| Quadrant D | 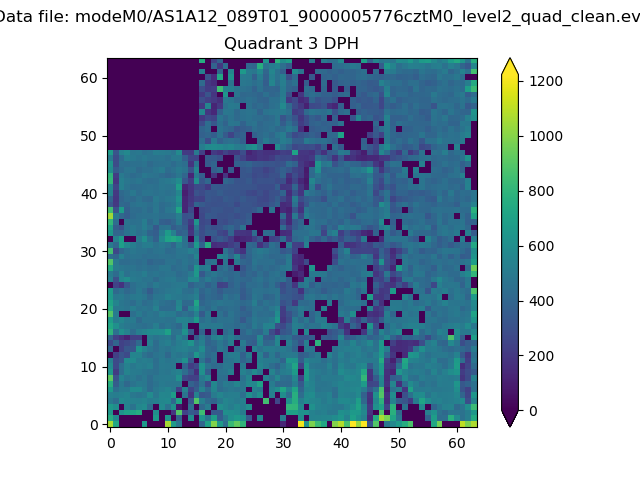 |
 |
Quadrant C |
| Plot type | Count rate plots | Images |
|---|---|---|
| Comparison with Poisson distribution Blue bars denote a histogram of data divided into 1 sec bins. Red curve is a Poisson curve with rate = median count rate of data. |
 |
 |
| Quadrant-wise count rates Data is divided into 100 sec bins |
 |
|
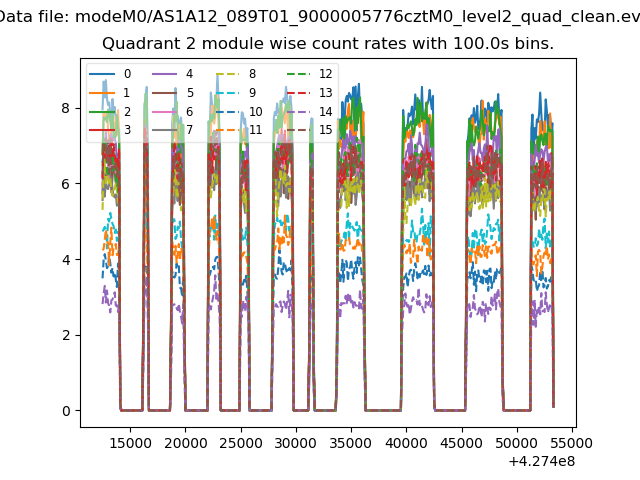
| Module-wise count rates for Quadrant A Data is divided into 100 sec bins |
 |
 |
| Module-wise count rates for Quadrant B Data is divided into 100 sec bins |
 |
 |
| Module-wise count rates for Quadrant C Data is divided into 100 sec bins |
 |
 |
| Module-wise count rates for Quadrant D Data is divided into 100 sec bins |
 |
 |
| Parameter | Plot |
|---|---|
| CZT HV Monitor |  |
| D_VDD |  |
| Temperature 1 |  |
| Veto HV Monitor | 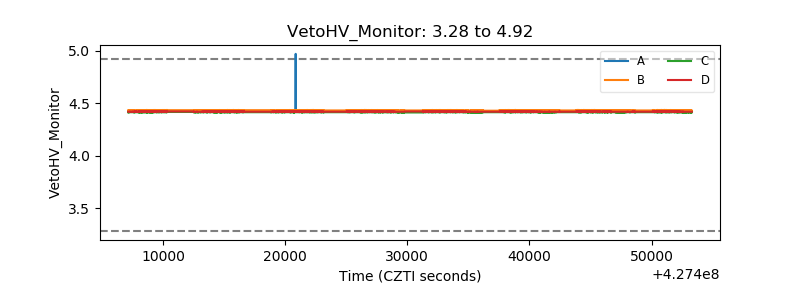 |
| Veto LLD |  |
| Alpha Counter |  |
| _CPM_Rate | 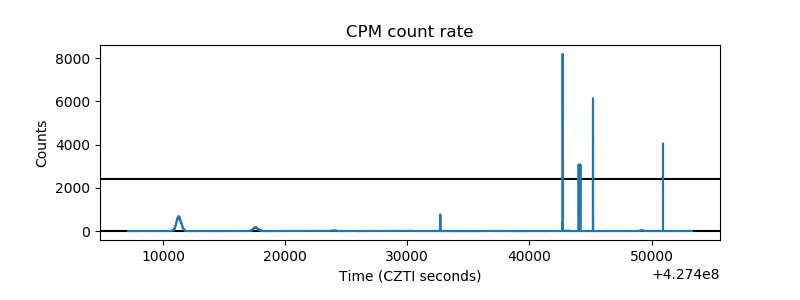 |
| CZT Counter | 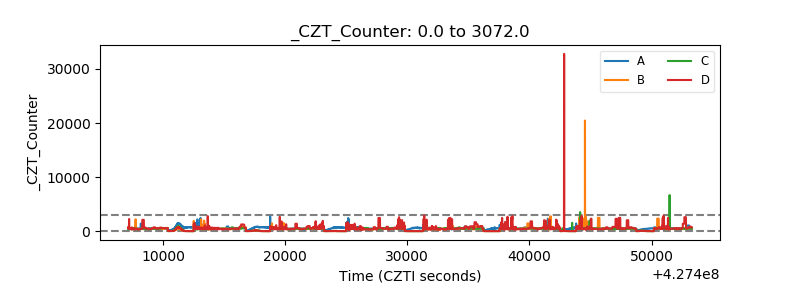 |
| +2.5 Volts monitor | 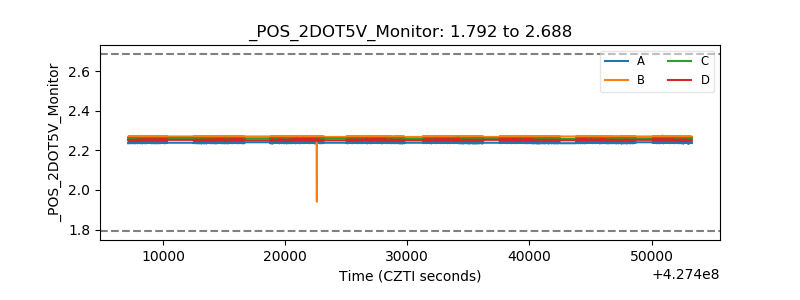 |
| +5 Volts monitor |  |
| _ROLL_ROT |  |
| _Roll_DEC | 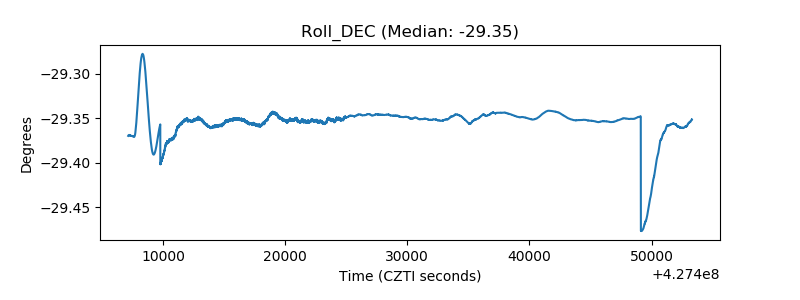 |
| _Roll_RA | 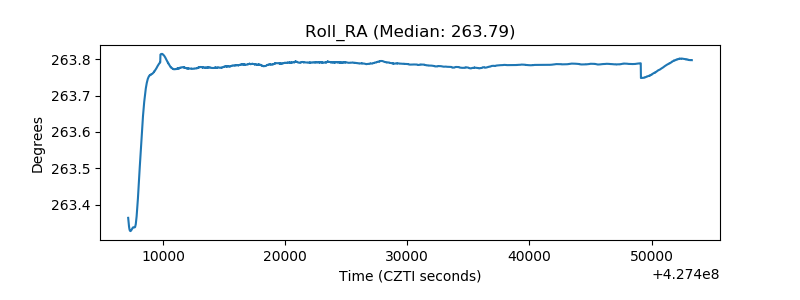 |
| Veto Counter | 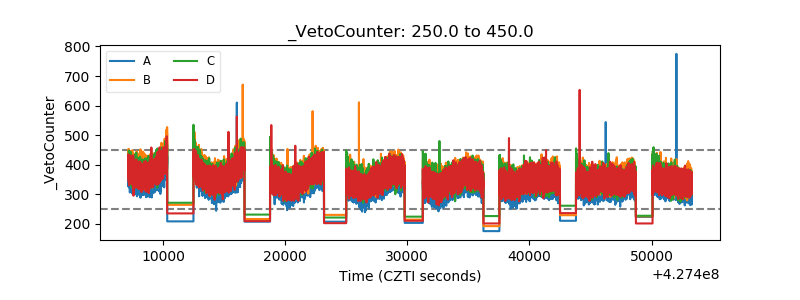 |