| Param | Original file | Final file |
|---|---|---|
| Filename | modeM0/AS1C07_001T10_9000005796cztM0_level2.fits | modeM0/AS1C07_001T10_9000005796cztM0_level2_quad_clean.evt |
| Size (bytes) | 821,649,600 | 1,050,408,000 |
| Size | 783.6 MB | 1001.7 MB |
| Events in quadrant A | 4,855,936 | 6,585,049 |
| Events in quadrant B | 4,667,340 | 6,631,485 |
| Events in quadrant C | 4,848,218 | 6,447,509 |
| Events in quadrant D | 4,064,568 | 5,705,738 |
| Mode M0 | |||
|---|---|---|---|
| Quadrant | BADHDUFLAG | Total packets | Discarded packets |
| A | 0 | 245657 | 0 |
| B | 0 | 199159 | 0 |
| C | 0 | 190878 | 0 |
| D | 0 | 260254 | 0 |
| Mode SS | |||
|---|---|---|---|
| Quadrant | BADHDUFLAG | Total packets | Discarded packets |
| A | 0 | 1924 | 0 |
| B | 0 | 1924 | 0 |
| C | 0 | 1924 | 0 |
| D | 0 | 1924 | 0 |
| Mode M9 | |||
|---|---|---|---|
| Quadrant | BADHDUFLAG | Total packets | Discarded packets |
| A | 0 | 342 | 0 |
| B | 0 | 342 | 0 |
| C | 0 | 342 | 0 |
| D | 0 | 342 | 0 |
| Quadrant | Total seconds | Saturated seconds | Saturation percentage |
|---|---|---|---|
| A | 94024 | 1955 | 2.079256% |
| B | 94023 | 599 | 0.637078% |
| C | 94023 | 95 | 0.101039% |
| D | 94023 | 4957 | 5.272114% |
Noise dominated data is calculated using 1-second bins in cleaned event files. If a bin has >2000 counts, and if more than 50% of those come from <1% of pixels, then it is considered to be noise-dominated and hence unusable.
| Quadrant | # 1 sec bins | Bins with >0 counts | Bins with >2000 counts | High rate bins dominated by noise | Noise dominated (total time) | Noise dominated (detector-on time) | Marked lightcurve |
|---|---|---|---|---|---|---|---|
| A | 132090 | 94023 | 0 | 0 | 0.00% | 0.00% | 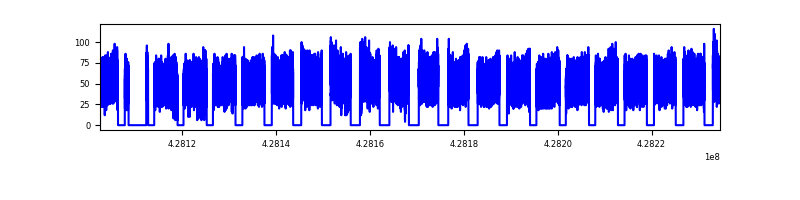 |
| B | 132089 | 94020 | 0 | 0 | 0.00% | 0.00% |  |
| C | 132090 | 94024 | 0 | 0 | 0.00% | 0.00% |  |
| D | 132090 | 93951 | 0 | 0 | 0.00% | 0.00% |  |
Top three noisy pixels from each quadrant. If the there are fewer than three noisy pixels in the level2.evt file, extra rows are filled as -1
| Pixel properties | Quadrant properties | ||||||
|---|---|---|---|---|---|---|---|
| Quadrant | DetID | PixID | Counts | Sigma | Mean | Median | Sigma |
| A | 0 | 29 | 4018 | 8.96 | 1268 | 1189 | 315.7 |
| A | 9 | 19 | 3982 | 8.85 | 1268 | 1189 | 315.7 |
| A | 7 | 110 | 3914 | 8.63 | 1268 | 1189 | 315.7 |
| B | 2 | 9 | 4169 | 12.49 | 1239 | 1185 | 238.9 |
| B | 3 | 80 | 3448 | 9.47 | 1239 | 1185 | 238.9 |
| B | 3 | 17 | 3371 | 9.15 | 1239 | 1185 | 238.9 |
| C | 1 | 81 | 4041 | 8.66 | 1281 | 1202 | 327.8 |
| C | 1 | 80 | 3942 | 8.36 | 1281 | 1202 | 327.8 |
| C | 3 | 202 | 3916 | 8.28 | 1281 | 1202 | 327.8 |
| D | 7 | 3 | 3138 | 6.62 | 1168 | 1065 | 313.2 |
| D | 10 | 189 | 3078 | 6.43 | 1168 | 1065 | 313.2 |
| D | 10 | 113 | 2986 | 6.13 | 1168 | 1065 | 313.2 |
Histogram calculated using DETX and DETY for each event in the final _common_clean file
| Quadrant A | 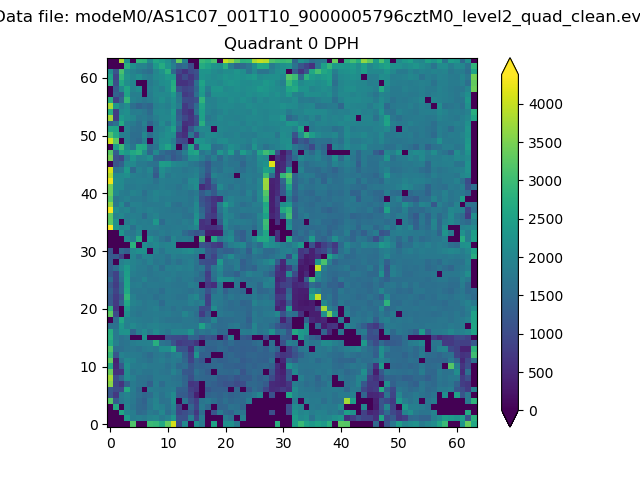 |
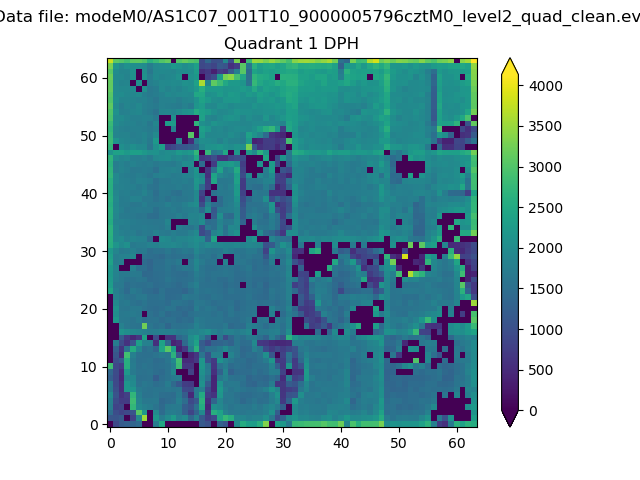 |
Quadrant B |
|---|---|---|---|
| Quadrant D |  |
 |
Quadrant C |
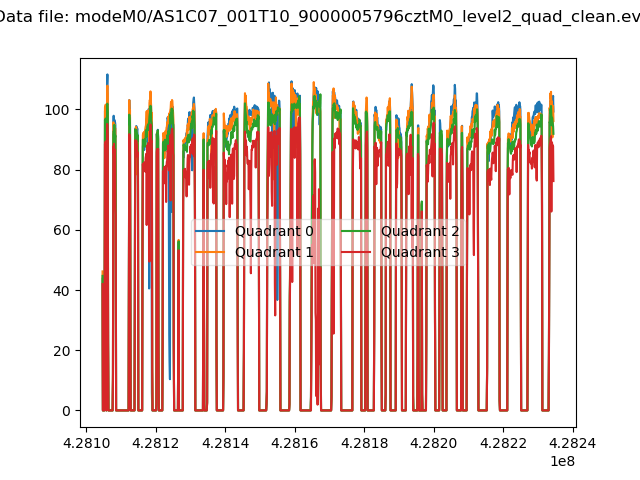
| Plot type | Count rate plots | Images |
|---|---|---|
| Comparison with Poisson distribution Blue bars denote a histogram of data divided into 1 sec bins. Red curve is a Poisson curve with rate = median count rate of data. |
 |
 |
| Quadrant-wise count rates Data is divided into 100 sec bins |
 |
|
| Module-wise count rates for Quadrant A Data is divided into 100 sec bins |
 |
 |
| Module-wise count rates for Quadrant B Data is divided into 100 sec bins |
 |
 |
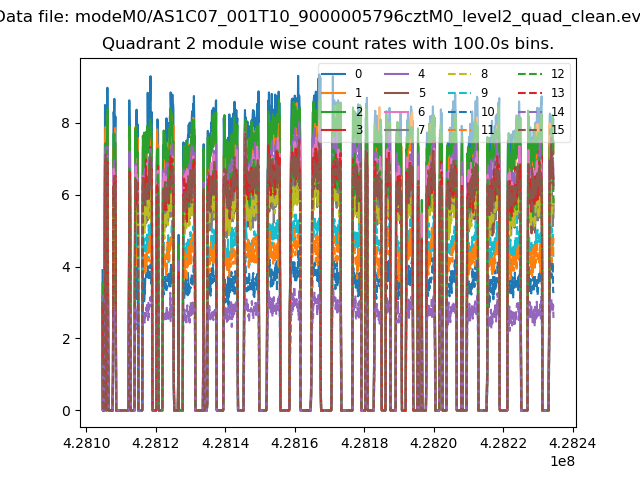
| Module-wise count rates for Quadrant C Data is divided into 100 sec bins |
 |
 |
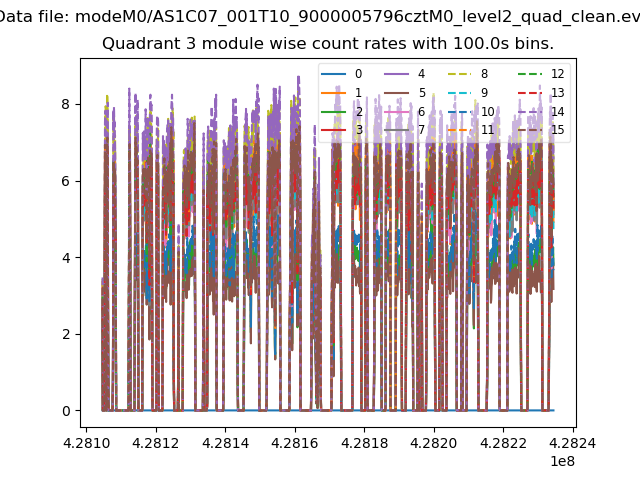
| Module-wise count rates for Quadrant D Data is divided into 100 sec bins |
 |
 |
| Parameter | Plot |
|---|---|
| CZT HV Monitor |  |
| D_VDD | 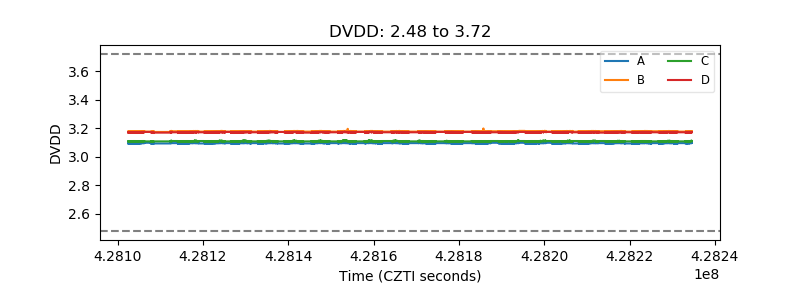 |
| Temperature 1 |  |
| Veto HV Monitor |  |
| Veto LLD |  |
| Alpha Counter |  |
| _CPM_Rate |  |
| CZT Counter |  |
| +2.5 Volts monitor |  |
| +5 Volts monitor |  |
| _ROLL_ROT |  |
| _Roll_DEC |  |
| _Roll_RA |  |
| Veto Counter |  |