| Param | Original file | Final file |
|---|---|---|
| Filename | modeM0/AS1A12_102T01_9000005798cztM0_level2.fits | modeM0/AS1A12_102T01_9000005798cztM0_level2_quad_clean.evt |
| Size (bytes) | 690,802,560 | 847,370,880 |
| Size | 658.8 MB | 808.1 MB |
| Events in quadrant A | 4,131,386 | 5,353,308 |
| Events in quadrant B | 3,928,460 | 5,262,200 |
| Events in quadrant C | 4,075,680 | 5,104,808 |
| Events in quadrant D | 3,497,380 | 4,657,134 |
| Mode M9 | |||
|---|---|---|---|
| Quadrant | BADHDUFLAG | Total packets | Discarded packets |
| A | 0 | 297 | 0 |
| B | 0 | 298 | 0 |
| C | 0 | 298 | 0 |
| D | 0 | 298 | 0 |
| Mode SS | |||
|---|---|---|---|
| Quadrant | BADHDUFLAG | Total packets | Discarded packets |
| A | 0 | 1580 | 0 |
| B | 0 | 1580 | 0 |
| C | 0 | 1580 | 0 |
| D | 0 | 1580 | 0 |
| Mode M0 | |||
|---|---|---|---|
| Quadrant | BADHDUFLAG | Total packets | Discarded packets |
| A | 0 | 167871 | 0 |
| B | 0 | 162974 | 0 |
| C | 0 | 155645 | 0 |
| D | 0 | 196452 | 0 |
| Quadrant | Total seconds | Saturated seconds | Saturation percentage |
|---|---|---|---|
| A | 77109 | 171 | 0.221764% |
| B | 77109 | 612 | 0.793682% |
| C | 77108 | 48 | 0.062250% |
| D | 77108 | 2387 | 3.095658% |
Noise dominated data is calculated using 1-second bins in cleaned event files. If a bin has >2000 counts, and if more than 50% of those come from <1% of pixels, then it is considered to be noise-dominated and hence unusable.
| Quadrant | # 1 sec bins | Bins with >0 counts | Bins with >2000 counts | High rate bins dominated by noise | Noise dominated (total time) | Noise dominated (detector-on time) | Marked lightcurve |
|---|---|---|---|---|---|---|---|
| A | 124697 | 77109 | 0 | 0 | 0.00% | 0.00% |  |
| B | 124697 | 77096 | 0 | 0 | 0.00% | 0.00% |  |
| C | 124697 | 77109 | 0 | 0 | 0.00% | 0.00% |  |
| D | 124697 | 77070 | 0 | 0 | 0.00% | 0.00% |  |
Top three noisy pixels from each quadrant. If the there are fewer than three noisy pixels in the level2.evt file, extra rows are filled as -1
| Pixel properties | Quadrant properties | ||||||
|---|---|---|---|---|---|---|---|
| Quadrant | DetID | PixID | Counts | Sigma | Mean | Median | Sigma |
| A | 7 | 110 | 3446 | 9.05 | 1080 | 1016 | 268.5 |
| A | 0 | 29 | 3339 | 8.65 | 1080 | 1016 | 268.5 |
| A | 9 | 19 | 3302 | 8.51 | 1080 | 1016 | 268.5 |
| B | 2 | 9 | 3399 | 12.24 | 1040 | 997 | 196.2 |
| B | 3 | 80 | 2906 | 9.73 | 1040 | 997 | 196.2 |
| B | 2 | 8 | 2794 | 9.16 | 1040 | 997 | 196.2 |
| C | 1 | 81 | 3412 | 8.64 | 1077 | 1010 | 278.1 |
| C | 3 | 202 | 3274 | 8.14 | 1077 | 1010 | 278.1 |
| C | 1 | 80 | 3223 | 7.96 | 1077 | 1010 | 278.1 |
| D | 4 | 160 | 2736 | 6.78 | 1002 | 915 | 268.5 |
| D | 3 | 14 | 2575 | 6.18 | 1002 | 915 | 268.5 |
| D | 10 | 189 | 2569 | 6.16 | 1002 | 915 | 268.5 |
Histogram calculated using DETX and DETY for each event in the final _common_clean file
| Quadrant A | 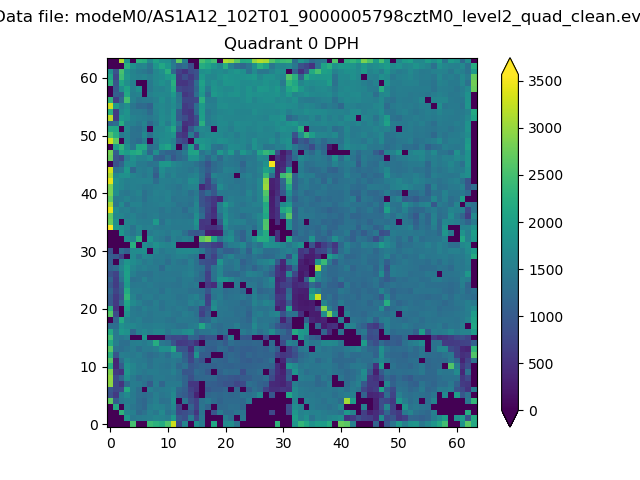 |
 |
Quadrant B |
|---|---|---|---|
| Quadrant D |  |
 |
Quadrant C |
| Plot type | Count rate plots | Images |
|---|---|---|
| Comparison with Poisson distribution Blue bars denote a histogram of data divided into 1 sec bins. Red curve is a Poisson curve with rate = median count rate of data. |
 |
 |
| Quadrant-wise count rates Data is divided into 100 sec bins |
 |
|
| Module-wise count rates for Quadrant A Data is divided into 100 sec bins |
 |
 |
| Module-wise count rates for Quadrant B Data is divided into 100 sec bins |
 |
 |
| Module-wise count rates for Quadrant C Data is divided into 100 sec bins |
 |
 |
| Module-wise count rates for Quadrant D Data is divided into 100 sec bins |
 |
 |
| Parameter | Plot |
|---|---|
| CZT HV Monitor |  |
| D_VDD | 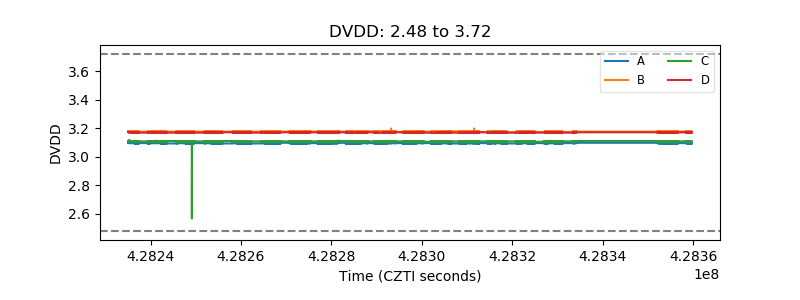 |
| Temperature 1 |  |
| Veto HV Monitor |  |
| Veto LLD |  |
| Alpha Counter |  |
| _CPM_Rate |  |
| CZT Counter |  |
| +2.5 Volts monitor |  |
| +5 Volts monitor |  |
| _ROLL_ROT |  |
| _Roll_DEC |  |
| _Roll_RA |  |
| Veto Counter |  |