| Param | Original file | Final file |
|---|---|---|
| Filename | modeM0/AS1T05_138T01_9000005802cztM0_level2.fits | modeM0/AS1T05_138T01_9000005802cztM0_level2_quad_clean.evt |
| Size (bytes) | 95,140,800 | 83,355,840 |
| Size | 90.7 MB | 79.5 MB |
| Events in quadrant A | 566,854 | 467,167 |
| Events in quadrant B | 543,502 | 464,594 |
| Events in quadrant C | 550,984 | 440,881 |
| Events in quadrant D | 477,772 | 408,597 |
| Mode M9 | |||
|---|---|---|---|
| Quadrant | BADHDUFLAG | Total packets | Discarded packets |
| A | 0 | 49 | 0 |
| B | 0 | 49 | 0 |
| C | 0 | 49 | 0 |
| D | 0 | 49 | 0 |
| Mode M0 | |||
|---|---|---|---|
| Quadrant | BADHDUFLAG | Total packets | Discarded packets |
| A | 0 | 23173 | 0 |
| B | 0 | 22789 | 0 |
| C | 0 | 23789 | 0 |
| D | 0 | 27371 | 0 |
| Mode SS | |||
|---|---|---|---|
| Quadrant | BADHDUFLAG | Total packets | Discarded packets |
| A | 0 | 222 | 0 |
| B | 0 | 222 | 0 |
| C | 0 | 222 | 0 |
| D | 0 | 222 | 0 |
| Quadrant | Total seconds | Saturated seconds | Saturation percentage |
|---|---|---|---|
| A | 10714 | 31 | 0.289341% |
| B | 10715 | 105 | 0.979935% |
| C | 10715 | 201 | 1.875875% |
| D | 10715 | 226 | 2.109193% |
Noise dominated data is calculated using 1-second bins in cleaned event files. If a bin has >2000 counts, and if more than 50% of those come from <1% of pixels, then it is considered to be noise-dominated and hence unusable.
| Quadrant | # 1 sec bins | Bins with >0 counts | Bins with >2000 counts | High rate bins dominated by noise | Noise dominated (total time) | Noise dominated (detector-on time) | Marked lightcurve |
|---|---|---|---|---|---|---|---|
| A | 15674 | 10712 | 0 | 0 | 0.00% | 0.00% | 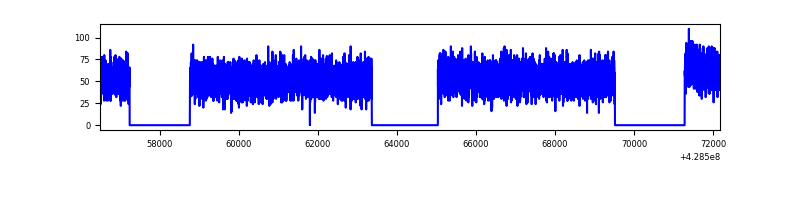 |
| B | 15675 | 10715 | 0 | 0 | 0.00% | 0.00% |  |
| C | 15675 | 10688 | 0 | 0 | 0.00% | 0.00% |  |
| D | 15675 | 10712 | 0 | 0 | 0.00% | 0.00% |  |
Top three noisy pixels from each quadrant. If the there are fewer than three noisy pixels in the level2.evt file, extra rows are filled as -1
| Pixel properties | Quadrant properties | ||||||
|---|---|---|---|---|---|---|---|
| Quadrant | DetID | PixID | Counts | Sigma | Mean | Median | Sigma |
| A | 9 | 19 | 495 | 9.23 | 148 | 139 | 38.6 |
| A | 0 | 29 | 468 | 8.53 | 148 | 139 | 38.6 |
| A | 7 | 110 | 447 | 7.99 | 148 | 139 | 38.6 |
| B | 2 | 9 | 457 | 10.45 | 144 | 137 | 30.6 |
| B | 3 | 80 | 401 | 8.62 | 144 | 137 | 30.6 |
| B | 3 | 17 | 400 | 8.59 | 144 | 137 | 30.6 |
| C | 1 | 81 | 452 | 8.13 | 145 | 136 | 38.9 |
| C | 1 | 80 | 433 | 7.64 | 145 | 136 | 38.9 |
| C | 3 | 187 | 403 | 6.87 | 145 | 136 | 38.9 |
| D | 10 | 189 | 369 | 6.52 | 136 | 124 | 37.6 |
| D | 7 | 3 | 363 | 6.36 | 136 | 124 | 37.6 |
| D | 10 | 113 | 349 | 5.99 | 136 | 124 | 37.6 |
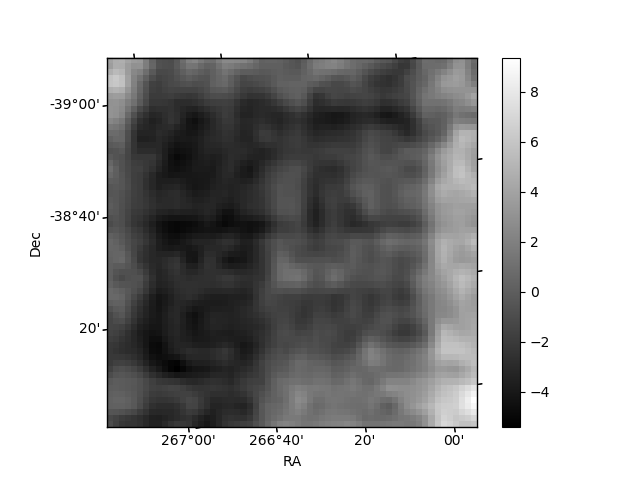
Histogram calculated using DETX and DETY for each event in the final _common_clean file
| Quadrant A | 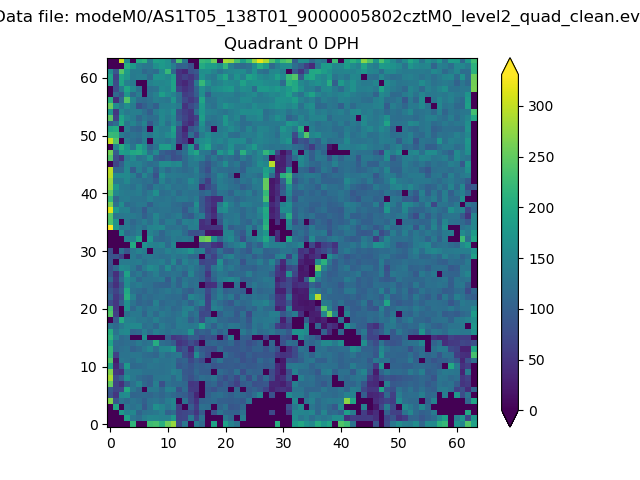 |
 |
Quadrant B |
|---|---|---|---|
| Quadrant D |  |
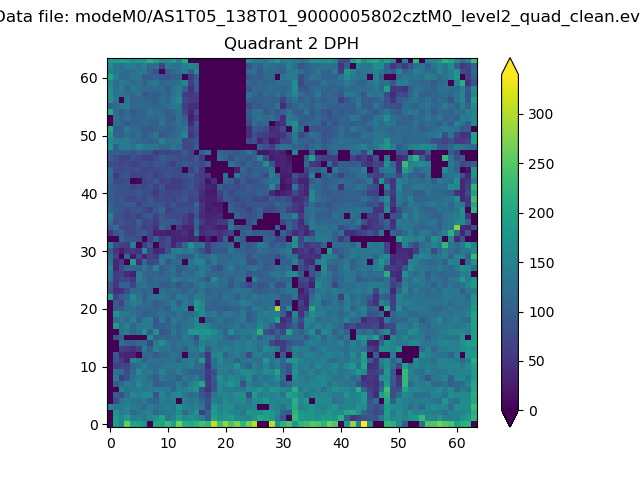 |
Quadrant C |
| Plot type | Count rate plots | Images |
|---|---|---|
| Comparison with Poisson distribution Blue bars denote a histogram of data divided into 1 sec bins. Red curve is a Poisson curve with rate = median count rate of data. |
 |
 |
| Quadrant-wise count rates Data is divided into 100 sec bins |
 |
|
| Module-wise count rates for Quadrant A Data is divided into 100 sec bins |
 |
 |
| Module-wise count rates for Quadrant B Data is divided into 100 sec bins |
 |
 |
| Module-wise count rates for Quadrant C Data is divided into 100 sec bins |
 |
 |
| Module-wise count rates for Quadrant D Data is divided into 100 sec bins |
 |
 |
| Parameter | Plot |
|---|---|
| CZT HV Monitor |  |
| D_VDD |  |
| Temperature 1 |  |
| Veto HV Monitor | 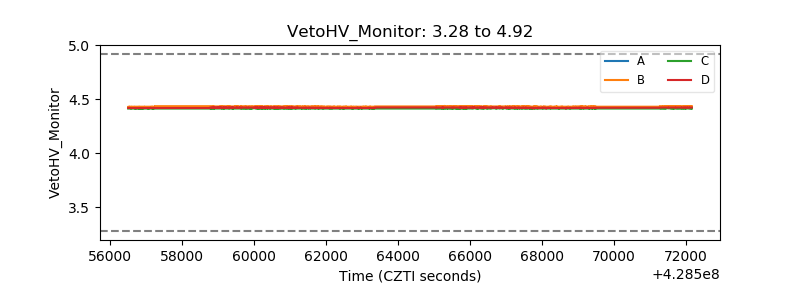 |
| Veto LLD | 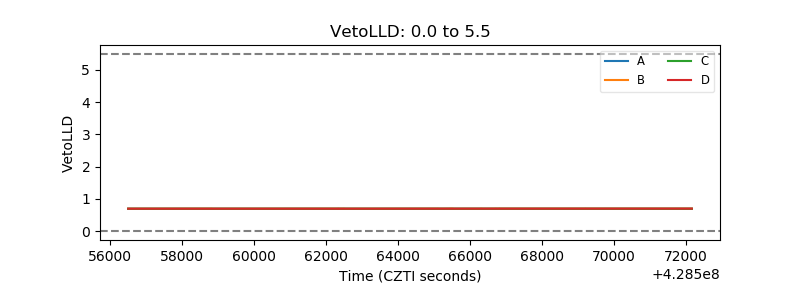 |
| Alpha Counter | 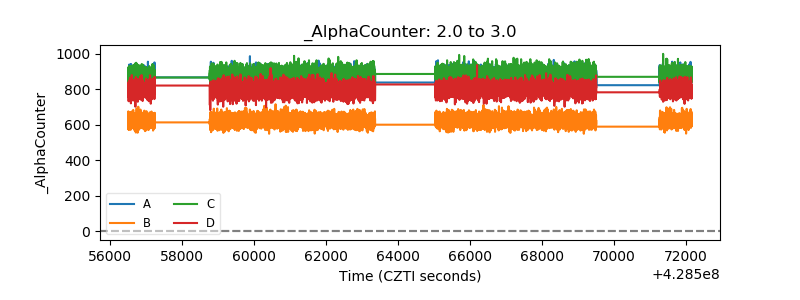 |
| _CPM_Rate | 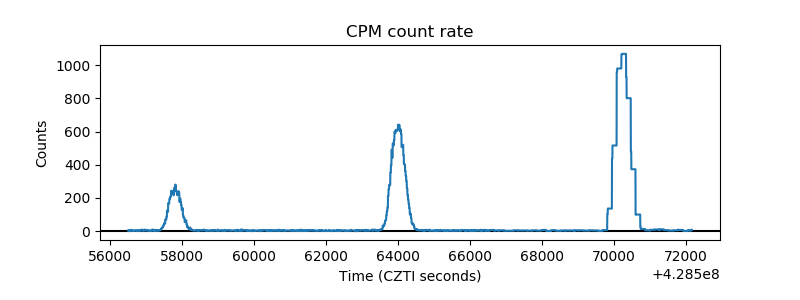 |
| CZT Counter | 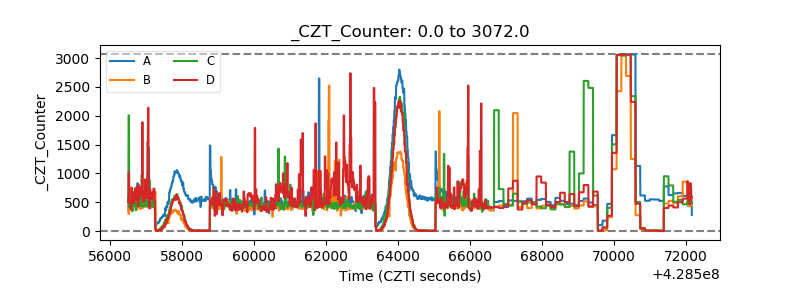 |
| +2.5 Volts monitor |  |
| +5 Volts monitor |  |
| _ROLL_ROT |  |
| _Roll_DEC |  |
| _Roll_RA |  |
| Veto Counter | 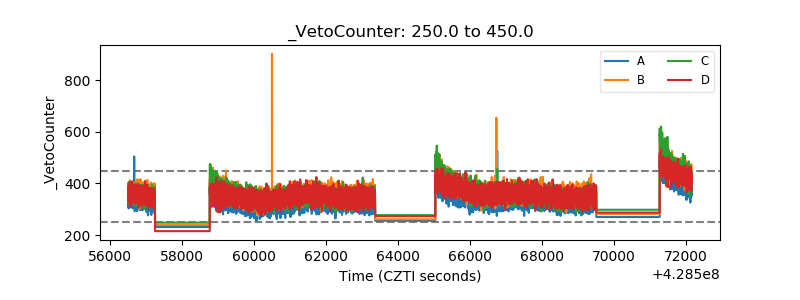 |