| Param | Original file | Final file |
|---|---|---|
| Filename | modeM0/AS1T05_138T01_9000005802cztM0_level2.fits | modeM0/AS1T05_138T01_9000005802cztM0_level2_quad_clean.evt |
| Size (bytes) | 289,025,280 | 306,239,040 |
| Size | 275.6 MB | 292.1 MB |
| Events in quadrant A | 1,749,432 | 1,864,795 |
| Events in quadrant B | 1,669,566 | 1,876,880 |
| Events in quadrant C | 1,709,946 | 1,821,624 |
| Events in quadrant D | 1,428,498 | 1,515,989 |
| Mode M9 | |||
|---|---|---|---|
| Quadrant | BADHDUFLAG | Total packets | Discarded packets |
| A | 0 | 120 | 0 |
| B | 0 | 120 | 0 |
| C | 0 | 120 | 0 |
| D | 0 | 120 | 0 |
| Mode M0 | |||
|---|---|---|---|
| Quadrant | BADHDUFLAG | Total packets | Discarded packets |
| A | 0 | 68638 | 0 |
| B | 0 | 66635 | 0 |
| C | 0 | 65601 | 0 |
| D | 0 | 102458 | 0 |
| Mode SS | |||
|---|---|---|---|
| Quadrant | BADHDUFLAG | Total packets | Discarded packets |
| A | 0 | 654 | 0 |
| B | 0 | 654 | 0 |
| C | 0 | 654 | 0 |
| D | 0 | 654 | 0 |
| Quadrant | Total seconds | Saturated seconds | Saturation percentage |
|---|---|---|---|
| A | 31938 | 49 | 0.153422% |
| B | 31935 | 137 | 0.428996% |
| C | 31936 | 72 | 0.225451% |
| D | 31937 | 2606 | 8.159815% |
Noise dominated data is calculated using 1-second bins in cleaned event files. If a bin has >2000 counts, and if more than 50% of those come from <1% of pixels, then it is considered to be noise-dominated and hence unusable.
| Quadrant | # 1 sec bins | Bins with >0 counts | Bins with >2000 counts | High rate bins dominated by noise | Noise dominated (total time) | Noise dominated (detector-on time) | Marked lightcurve |
|---|---|---|---|---|---|---|---|
| A | 44004 | 31939 | 0 | 0 | 0.00% | 0.00% |  |
| B | 44004 | 31934 | 0 | 0 | 0.00% | 0.00% |  |
| C | 44004 | 31936 | 0 | 0 | 0.00% | 0.00% |  |
| D | 44004 | 31914 | 0 | 0 | 0.00% | 0.00% |  |
Top three noisy pixels from each quadrant. If the there are fewer than three noisy pixels in the level2.evt file, extra rows are filled as -1
| Pixel properties | Quadrant properties | ||||||
|---|---|---|---|---|---|---|---|
| Quadrant | DetID | PixID | Counts | Sigma | Mean | Median | Sigma |
| A | 0 | 29 | 1470 | 9.01 | 457 | 430 | 115.5 |
| A | 7 | 110 | 1450 | 8.83 | 457 | 430 | 115.5 |
| A | 9 | 19 | 1402 | 8.42 | 457 | 430 | 115.5 |
| B | 2 | 9 | 1426 | 11.56 | 442 | 423 | 86.7 |
| B | 3 | 80 | 1225 | 9.25 | 442 | 423 | 86.7 |
| B | 3 | 17 | 1200 | 8.96 | 442 | 423 | 86.7 |
| C | 1 | 81 | 1386 | 8.32 | 451 | 424 | 115.6 |
| C | 3 | 202 | 1377 | 8.25 | 451 | 424 | 115.6 |
| C | 1 | 80 | 1356 | 8.06 | 451 | 424 | 115.6 |
| D | 7 | 3 | 1105 | 6.71 | 409 | 372 | 109.2 |
| D | 6 | 67 | 1063 | 6.33 | 409 | 372 | 109.2 |
| D | 10 | 189 | 1059 | 6.29 | 409 | 372 | 109.2 |
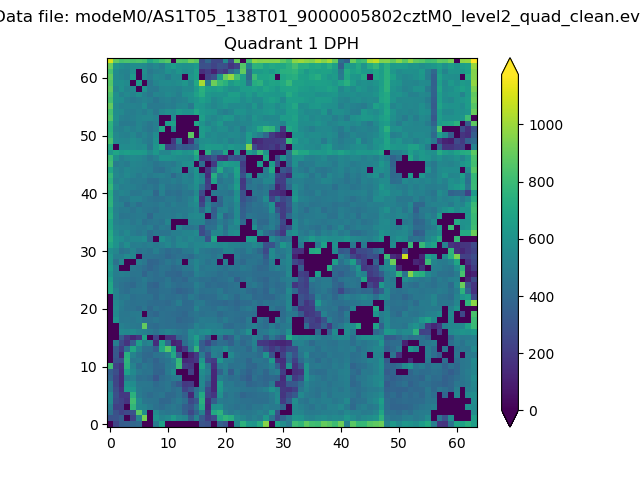
Histogram calculated using DETX and DETY for each event in the final _common_clean file
| Quadrant A |  |
 |
Quadrant B |
|---|---|---|---|
| Quadrant D |  |
 |
Quadrant C |
| Plot type | Count rate plots | Images |
|---|---|---|
| Comparison with Poisson distribution Blue bars denote a histogram of data divided into 1 sec bins. Red curve is a Poisson curve with rate = median count rate of data. |
 |
 |
| Quadrant-wise count rates Data is divided into 100 sec bins |
 |
|
| Module-wise count rates for Quadrant A Data is divided into 100 sec bins |
 |
 |
| Module-wise count rates for Quadrant B Data is divided into 100 sec bins |
 |
 |
| Module-wise count rates for Quadrant C Data is divided into 100 sec bins |
 |
 |
| Module-wise count rates for Quadrant D Data is divided into 100 sec bins |
 |
 |
| Parameter | Plot |
|---|---|
| CZT HV Monitor |  |
| D_VDD | 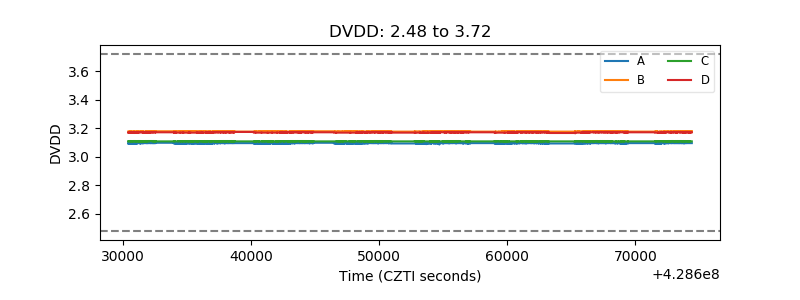 |
| Temperature 1 |  |
| Veto HV Monitor |  |
| Veto LLD |  |
| Alpha Counter |  |
| _CPM_Rate |  |
| CZT Counter |  |
| +2.5 Volts monitor |  |
| +5 Volts monitor |  |
| _ROLL_ROT |  |
| _Roll_DEC |  |
| _Roll_RA |  |
| Veto Counter |  |