| Param | Original file | Final file |
|---|---|---|
| Filename | modeM0/AS1C07_001T10_9000005806cztM0_level2.fits | modeM0/AS1C07_001T10_9000005806cztM0_level2_quad_clean.evt |
| Size (bytes) | 3,269,681,280 | 4,430,640,960 |
| Size | 3.0 GB | 4.1 GB |
| Events in quadrant A | 19,794,558 | 29,793,505 |
| Events in quadrant B | 17,683,166 | 25,900,823 |
| Events in quadrant C | 18,990,032 | 27,420,083 |
| Events in quadrant D | 16,350,876 | 24,914,314 |
| Mode M9 | |||
|---|---|---|---|
| Quadrant | BADHDUFLAG | Total packets | Discarded packets |
| A | 0 | 1452 | 0 |
| B | 0 | 1453 | 0 |
| C | 0 | 1453 | 0 |
| D | 0 | 1453 | 0 |
| Mode SS | |||
|---|---|---|---|
| Quadrant | BADHDUFLAG | Total packets | Discarded packets |
| A | 0 | 7822 | 0 |
| B | 0 | 7822 | 0 |
| C | 0 | 7822 | 0 |
| D | 0 | 7822 | 0 |
| Mode M0 | |||
|---|---|---|---|
| Quadrant | BADHDUFLAG | Total packets | Discarded packets |
| A | 0 | 845905 | 0 |
| B | 0 | 1038354 | 0 |
| C | 0 | 896189 | 0 |
| D | 0 | 1091317 | 0 |
| Quadrant | Total seconds | Saturated seconds | Saturation percentage |
|---|---|---|---|
| A | 382143 | 1738 | 0.454804% |
| B | 382144 | 37771 | 9.883970% |
| C | 382144 | 9993 | 2.614983% |
| D | 382137 | 24428 | 6.392472% |
Noise dominated data is calculated using 1-second bins in cleaned event files. If a bin has >2000 counts, and if more than 50% of those come from <1% of pixels, then it is considered to be noise-dominated and hence unusable.
| Quadrant | # 1 sec bins | Bins with >0 counts | Bins with >2000 counts | High rate bins dominated by noise | Noise dominated (total time) | Noise dominated (detector-on time) | Marked lightcurve |
|---|---|---|---|---|---|---|---|
| A | 526977 | 382150 | 0 | 0 | 0.00% | 0.00% |  |
| B | 526977 | 381746 | 0 | 0 | 0.00% | 0.00% |  |
| C | 526977 | 382135 | 0 | 0 | 0.00% | 0.00% |  |
| D | 526977 | 381673 | 0 | 0 | 0.00% | 0.00% |  |
Top three noisy pixels from each quadrant. If the there are fewer than three noisy pixels in the level2.evt file, extra rows are filled as -1
| Pixel properties | Quadrant properties | ||||||
|---|---|---|---|---|---|---|---|
| Quadrant | DetID | PixID | Counts | Sigma | Mean | Median | Sigma |
| A | 7 | 110 | 16661 | 9.31 | 5177 | 4873 | 1266.8 |
| A | 0 | 29 | 16560 | 9.23 | 5177 | 4873 | 1266.8 |
| A | 9 | 19 | 16284 | 9.01 | 5177 | 4873 | 1266.8 |
| B | 2 | 9 | 15271 | 12.1 | 4683 | 4479 | 892.0 |
| B | 3 | 80 | 12928 | 9.47 | 4683 | 4479 | 892.0 |
| B | 2 | 8 | 12346 | 8.82 | 4683 | 4479 | 892.0 |
| C | 1 | 81 | 15992 | 8.91 | 5020 | 4710 | 1266.9 |
| C | 3 | 202 | 15443 | 8.47 | 5020 | 4710 | 1266.9 |
| C | 1 | 80 | 15323 | 8.38 | 5020 | 4710 | 1266.9 |
| D | 4 | 160 | 12492 | 6.54 | 4694 | 4279 | 1254.9 |
| D | 7 | 3 | 12446 | 6.51 | 4694 | 4279 | 1254.9 |
| D | 10 | 189 | 12233 | 6.34 | 4694 | 4279 | 1254.9 |
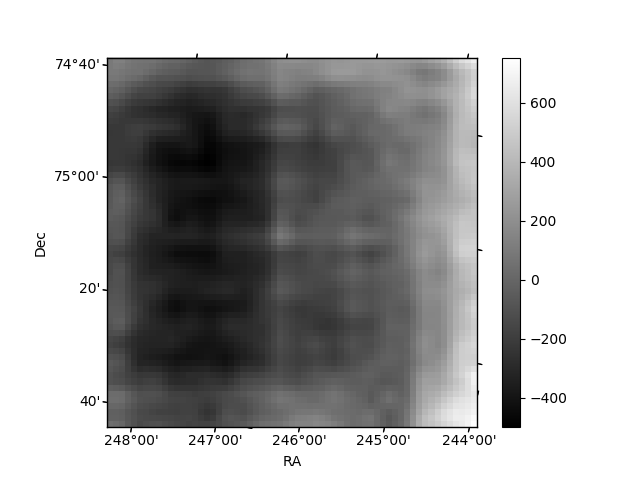
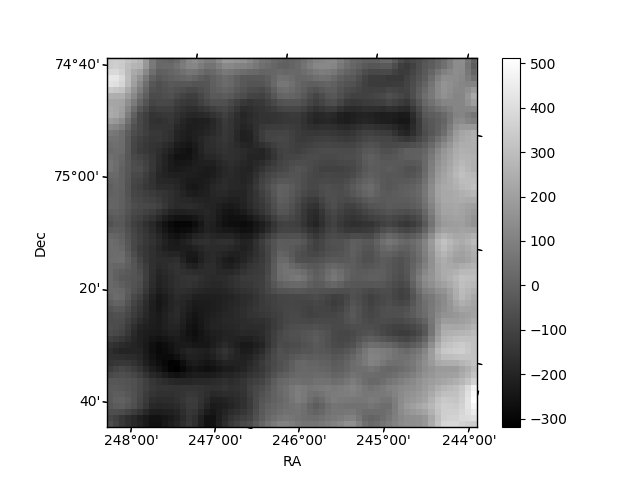
Histogram calculated using DETX and DETY for each event in the final _common_clean file
| Quadrant A | 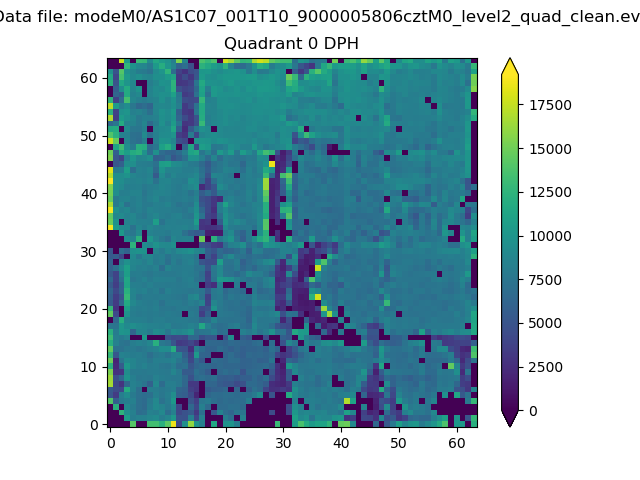 |
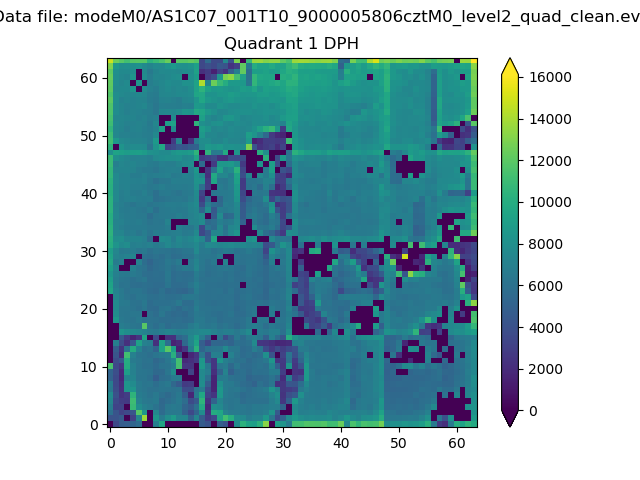 |
Quadrant B |
|---|---|---|---|
| Quadrant D | 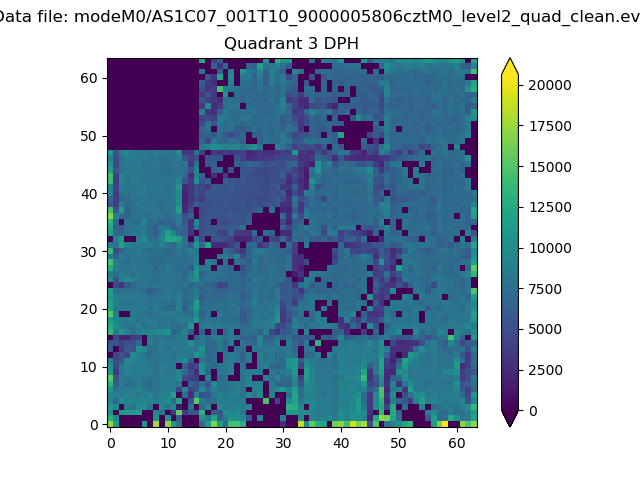 |
 |
Quadrant C |
| Plot type | Count rate plots | Images |
|---|---|---|
| Comparison with Poisson distribution Blue bars denote a histogram of data divided into 1 sec bins. Red curve is a Poisson curve with rate = median count rate of data. |
 |
 |
| Quadrant-wise count rates Data is divided into 100 sec bins |
 |
|
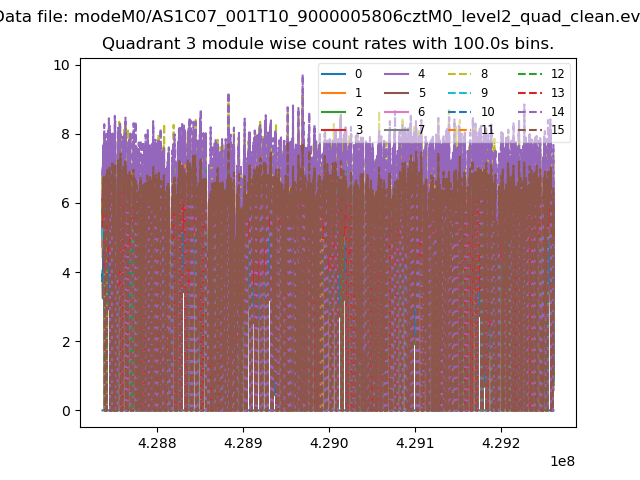
| Module-wise count rates for Quadrant A Data is divided into 100 sec bins |
 |
 |
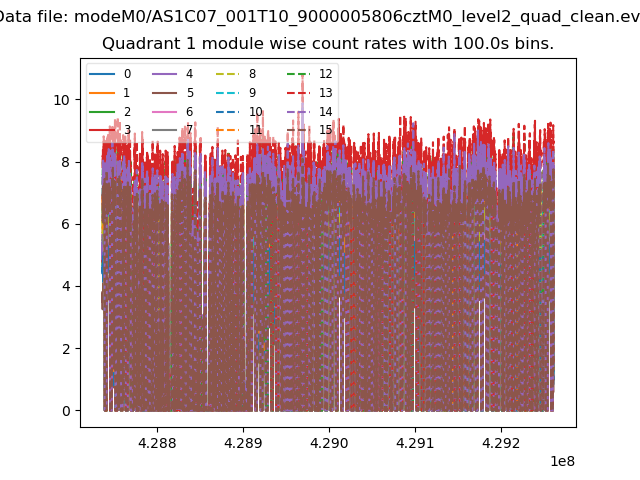
| Module-wise count rates for Quadrant B Data is divided into 100 sec bins |
 |
 |
| Module-wise count rates for Quadrant C Data is divided into 100 sec bins |
 |
 |
| Module-wise count rates for Quadrant D Data is divided into 100 sec bins |
 |
 |
| Parameter | Plot |
|---|---|
| CZT HV Monitor | 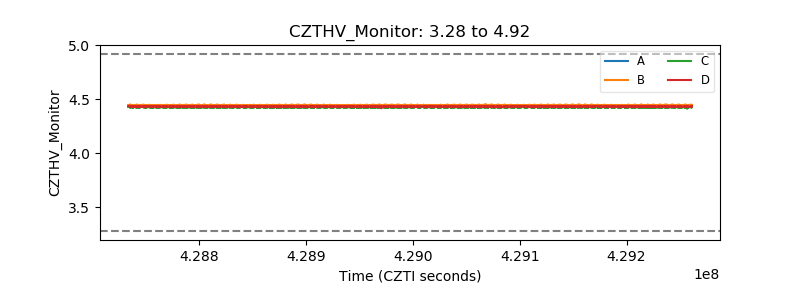 |
| D_VDD |  |
| Temperature 1 |  |
| Veto HV Monitor |  |
| Veto LLD |  |
| Alpha Counter |  |
| _CPM_Rate |  |
| CZT Counter |  |
| +2.5 Volts monitor |  |
| +5 Volts monitor | 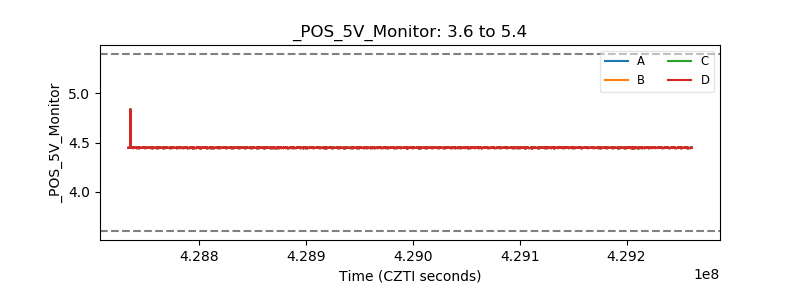 |
| _ROLL_ROT | 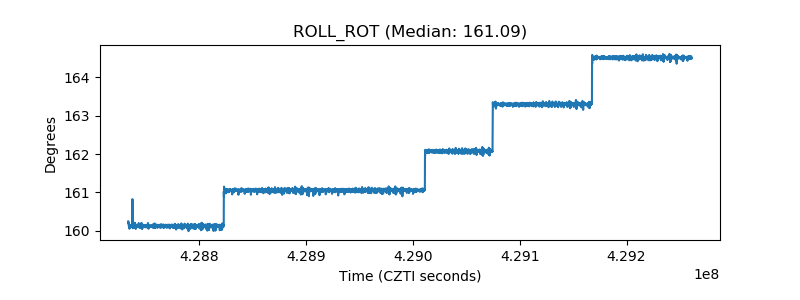 |
| _Roll_DEC |  |
| _Roll_RA | 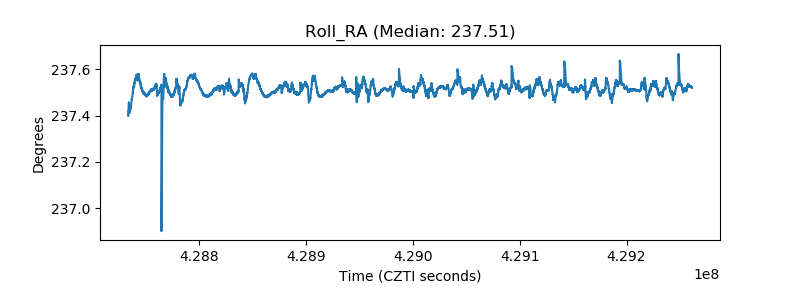 |
| Veto Counter |  |