| Param | Original file | Final file |
|---|---|---|
| Filename | modeM0/AS1A07_041T01_9000005808cztM0_level2.fits | modeM0/AS1A07_041T01_9000005808cztM0_level2_quad_clean.evt |
| Size (bytes) | 443,505,600 | 515,433,600 |
| Size | 423.0 MB | 491.6 MB |
| Events in quadrant A | 2,621,688 | 3,154,682 |
| Events in quadrant B | 2,518,774 | 3,146,749 |
| Events in quadrant C | 2,558,116 | 3,006,924 |
| Events in quadrant D | 2,250,286 | 2,820,095 |
| Mode M0 | |||
|---|---|---|---|
| Quadrant | BADHDUFLAG | Total packets | Discarded packets |
| A | 0 | 107647 | 0 |
| B | 0 | 104242 | 0 |
| C | 0 | 122009 | 0 |
| D | 0 | 110592 | 0 |
| Mode SS | |||
|---|---|---|---|
| Quadrant | BADHDUFLAG | Total packets | Discarded packets |
| A | 0 | 1036 | 0 |
| B | 0 | 1036 | 0 |
| C | 0 | 1036 | 0 |
| D | 0 | 1036 | 0 |
| Mode M9 | |||
|---|---|---|---|
| Quadrant | BADHDUFLAG | Total packets | Discarded packets |
| A | 0 | 183 | 0 |
| B | 0 | 183 | 0 |
| C | 0 | 183 | 0 |
| D | 0 | 183 | 0 |
| Quadrant | Total seconds | Saturated seconds | Saturation percentage |
|---|---|---|---|
| A | 50750 | 85 | 0.167488% |
| B | 50751 | 158 | 0.311324% |
| C | 50751 | 1353 | 2.665957% |
| D | 50751 | 616 | 1.213769% |
Noise dominated data is calculated using 1-second bins in cleaned event files. If a bin has >2000 counts, and if more than 50% of those come from <1% of pixels, then it is considered to be noise-dominated and hence unusable.
| Quadrant | # 1 sec bins | Bins with >0 counts | Bins with >2000 counts | High rate bins dominated by noise | Noise dominated (total time) | Noise dominated (detector-on time) | Marked lightcurve |
|---|---|---|---|---|---|---|---|
| A | 69028 | 50750 | 0 | 0 | 0.00% | 0.00% | 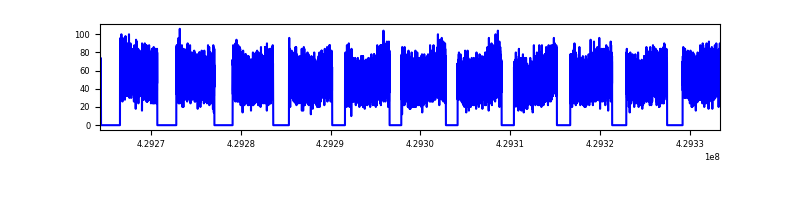 |
| B | 69029 | 50751 | 0 | 0 | 0.00% | 0.00% |  |
| C | 69029 | 50747 | 0 | 0 | 0.00% | 0.00% |  |
| D | 69029 | 50746 | 0 | 0 | 0.00% | 0.00% | 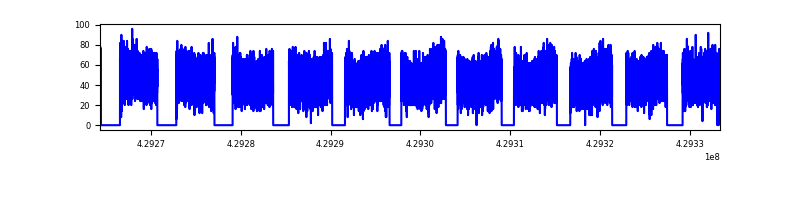 |
Top three noisy pixels from each quadrant. If the there are fewer than three noisy pixels in the level2.evt file, extra rows are filled as -1
| Pixel properties | Quadrant properties | ||||||
|---|---|---|---|---|---|---|---|
| Quadrant | DetID | PixID | Counts | Sigma | Mean | Median | Sigma |
| A | 7 | 110 | 2229 | 9.25 | 683 | 641 | 171.7 |
| A | 0 | 29 | 2160 | 8.85 | 683 | 641 | 171.7 |
| A | 9 | 19 | 2076 | 8.36 | 683 | 641 | 171.7 |
| B | 2 | 9 | 2129 | 11.38 | 665 | 631 | 131.7 |
| B | 3 | 80 | 1834 | 9.14 | 665 | 631 | 131.7 |
| B | 3 | 17 | 1778 | 8.71 | 665 | 631 | 131.7 |
| C | 1 | 81 | 2151 | 8.67 | 675 | 631 | 175.4 |
| C | 3 | 203 | 2027 | 7.96 | 675 | 631 | 175.4 |
| C | 3 | 202 | 1999 | 7.8 | 675 | 631 | 175.4 |
| D | 4 | 160 | 1735 | 6.64 | 643 | 585 | 173.3 |
| D | 3 | 14 | 1690 | 6.38 | 643 | 585 | 173.3 |
| D | 7 | 3 | 1680 | 6.32 | 643 | 585 | 173.3 |
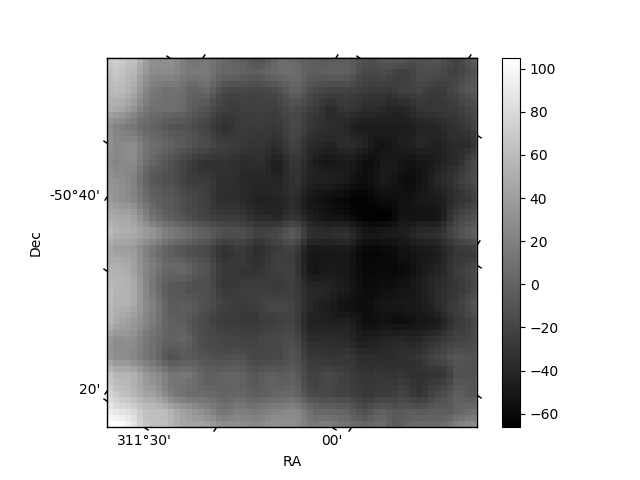
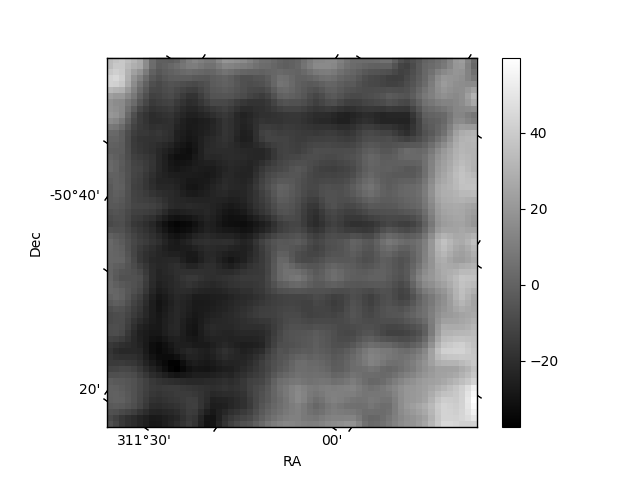
Histogram calculated using DETX and DETY for each event in the final _common_clean file
| Quadrant A | 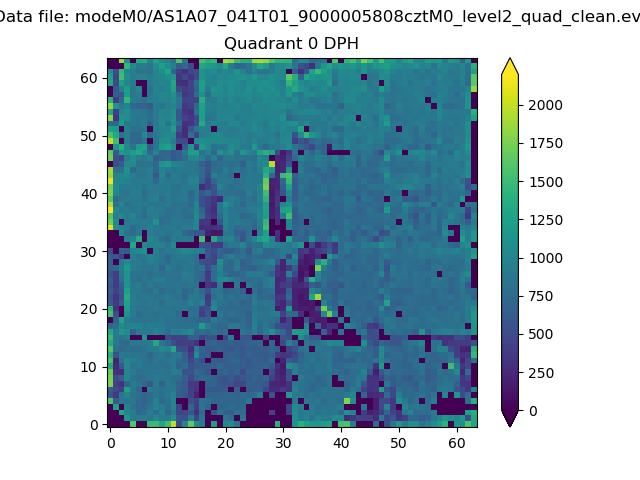 |
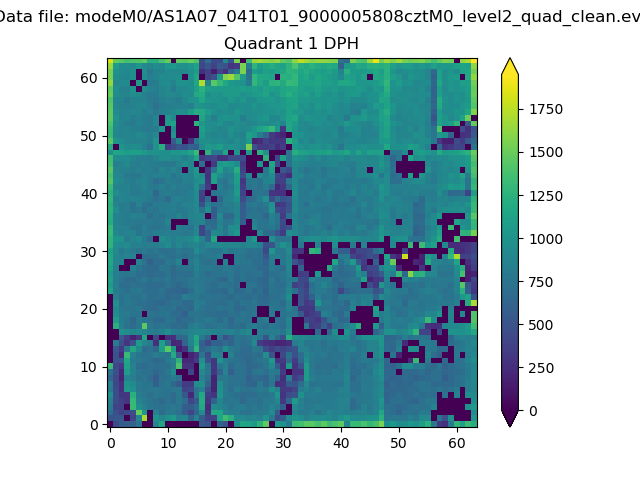 |
Quadrant B |
|---|---|---|---|
| Quadrant D |  |
 |
Quadrant C |
| Plot type | Count rate plots | Images |
|---|---|---|
| Comparison with Poisson distribution Blue bars denote a histogram of data divided into 1 sec bins. Red curve is a Poisson curve with rate = median count rate of data. |
 |
 |
| Quadrant-wise count rates Data is divided into 100 sec bins |
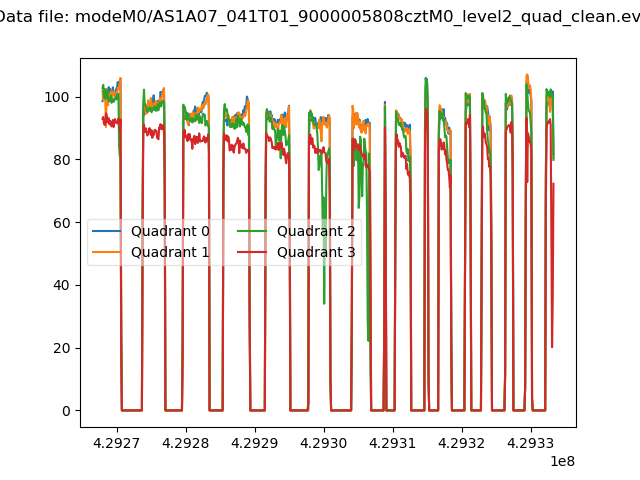 |
|
| Module-wise count rates for Quadrant A Data is divided into 100 sec bins |
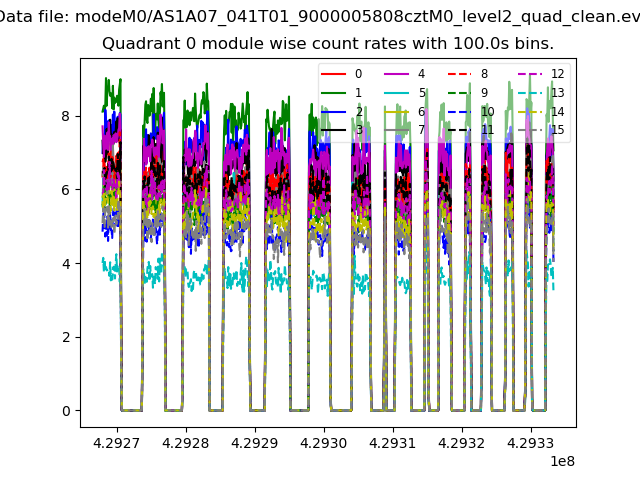 |
 |
| Module-wise count rates for Quadrant B Data is divided into 100 sec bins |
 |
 |
| Module-wise count rates for Quadrant C Data is divided into 100 sec bins |
 |
 |
| Module-wise count rates for Quadrant D Data is divided into 100 sec bins |
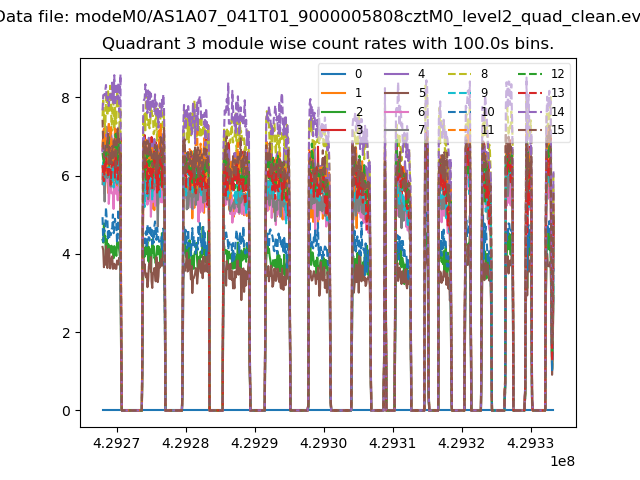 |
 |
| Parameter | Plot |
|---|---|
| CZT HV Monitor |  |
| D_VDD |  |
| Temperature 1 |  |
| Veto HV Monitor |  |
| Veto LLD | 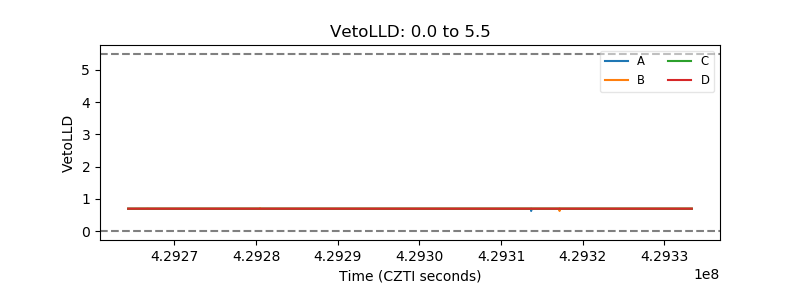 |
| Alpha Counter |  |
| _CPM_Rate | 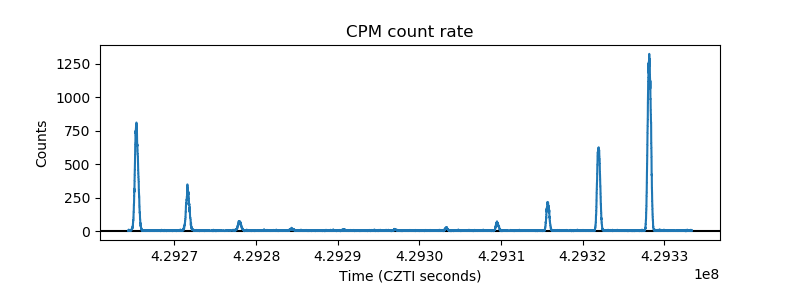 |
| CZT Counter |  |
| +2.5 Volts monitor |  |
| +5 Volts monitor | 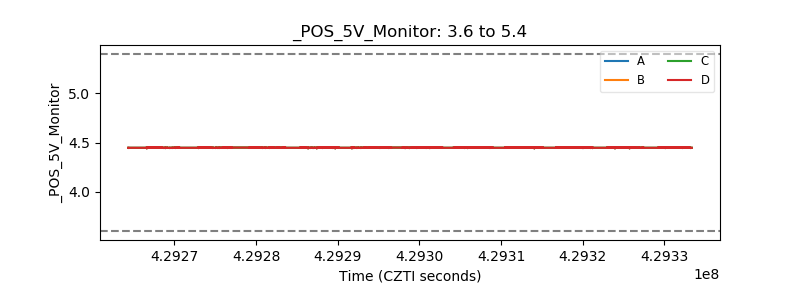 |
| _ROLL_ROT | 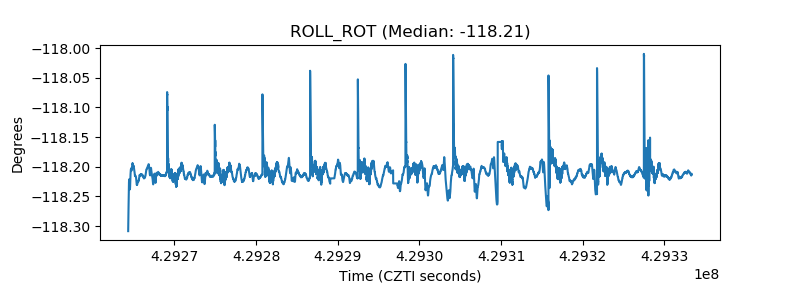 |
| _Roll_DEC | 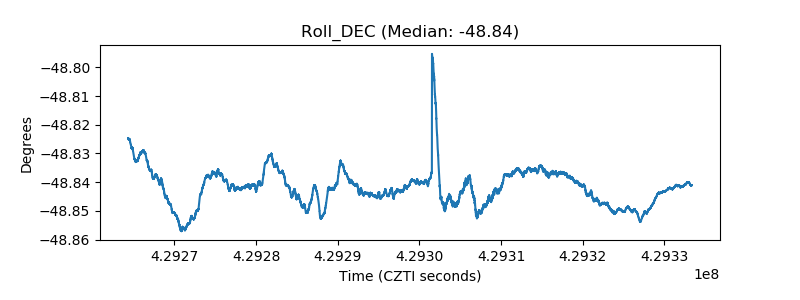 |
| _Roll_RA | 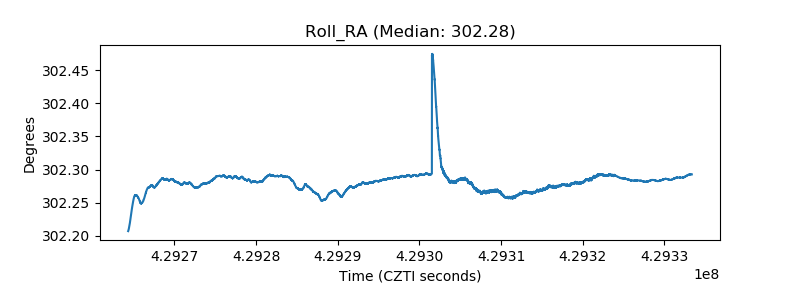 |
| Veto Counter |  |