| Param | Original file | Final file |
|---|---|---|
| Filename | modeM0/AS1A09_002T01_9000005810cztM0_level2.fits | modeM0/AS1A09_002T01_9000005810cztM0_level2_quad_clean.evt |
| Size (bytes) | 488,747,520 | 701,395,200 |
| Size | 466.1 MB | 668.9 MB |
| Events in quadrant A | 2,917,840 | 4,563,876 |
| Events in quadrant B | 2,783,620 | 4,545,161 |
| Events in quadrant C | 2,846,354 | 4,397,723 |
| Events in quadrant D | 2,462,836 | 3,947,680 |
| Mode M0 | |||
|---|---|---|---|
| Quadrant | BADHDUFLAG | Total packets | Discarded packets |
| A | 0 | 118739 | 0 |
| B | 0 | 116846 | 0 |
| C | 0 | 121616 | 0 |
| D | 0 | 136564 | 0 |
| Mode M9 | |||
|---|---|---|---|
| Quadrant | BADHDUFLAG | Total packets | Discarded packets |
| A | 0 | 203 | 0 |
| B | 0 | 203 | 0 |
| C | 0 | 203 | 0 |
| D | 0 | 203 | 0 |
| Mode SS | |||
|---|---|---|---|
| Quadrant | BADHDUFLAG | Total packets | Discarded packets |
| A | 0 | 1130 | 0 |
| B | 0 | 1130 | 0 |
| C | 0 | 1130 | 0 |
| D | 0 | 1130 | 0 |
| Quadrant | Total seconds | Saturated seconds | Saturation percentage |
|---|---|---|---|
| A | 55243 | 172 | 0.311352% |
| B | 55246 | 465 | 0.841690% |
| C | 55239 | 959 | 1.736092% |
| D | 55247 | 1765 | 3.194744% |
Noise dominated data is calculated using 1-second bins in cleaned event files. If a bin has >2000 counts, and if more than 50% of those come from <1% of pixels, then it is considered to be noise-dominated and hence unusable.
| Quadrant | # 1 sec bins | Bins with >0 counts | Bins with >2000 counts | High rate bins dominated by noise | Noise dominated (total time) | Noise dominated (detector-on time) | Marked lightcurve |
|---|---|---|---|---|---|---|---|
| A | 75648 | 55248 | 0 | 0 | 0.00% | 0.00% |  |
| B | 75648 | 55247 | 0 | 0 | 0.00% | 0.00% |  |
| C | 75649 | 55248 | 0 | 0 | 0.00% | 0.00% |  |
| D | 75649 | 55241 | 0 | 0 | 0.00% | 0.00% | 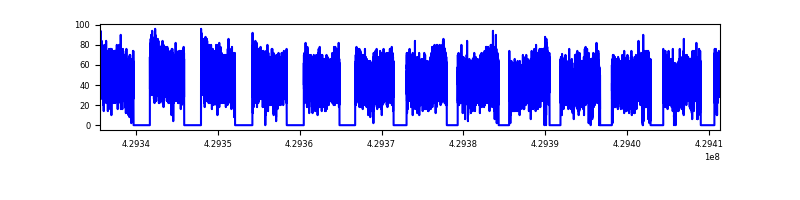 |
Top three noisy pixels from each quadrant. If the there are fewer than three noisy pixels in the level2.evt file, extra rows are filled as -1
| Pixel properties | Quadrant properties | ||||||
|---|---|---|---|---|---|---|---|
| Quadrant | DetID | PixID | Counts | Sigma | Mean | Median | Sigma |
| A | 9 | 19 | 2454 | 9.04 | 760 | 715 | 192.3 |
| A | 0 | 29 | 2373 | 8.62 | 760 | 715 | 192.3 |
| A | 7 | 110 | 2330 | 8.4 | 760 | 715 | 192.3 |
| B | 2 | 9 | 2402 | 12.14 | 735 | 704 | 139.9 |
| B | 3 | 80 | 2034 | 9.51 | 735 | 704 | 139.9 |
| B | 3 | 17 | 1934 | 8.79 | 735 | 704 | 139.9 |
| C | 1 | 81 | 2377 | 8.6 | 753 | 707 | 194.2 |
| C | 3 | 203 | 2318 | 8.3 | 753 | 707 | 194.2 |
| C | 3 | 202 | 2289 | 8.15 | 753 | 707 | 194.2 |
| D | 7 | 3 | 1878 | 6.55 | 704 | 644 | 188.3 |
| D | 6 | 38 | 1824 | 6.27 | 704 | 644 | 188.3 |
| D | 3 | 14 | 1823 | 6.26 | 704 | 644 | 188.3 |
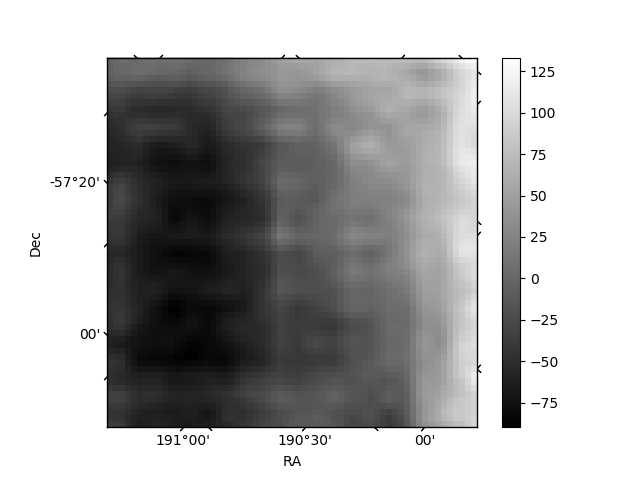
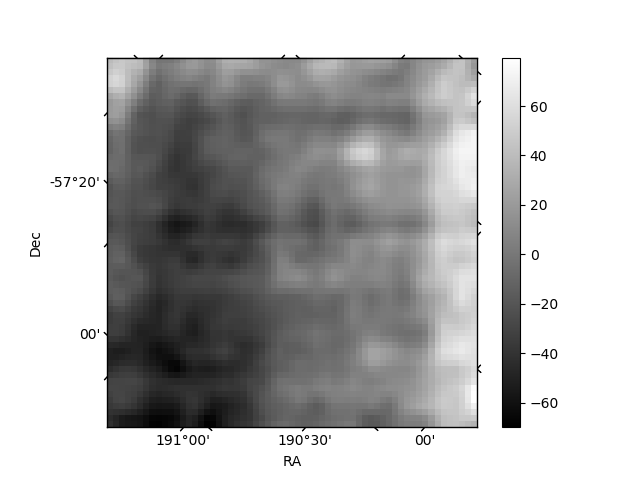
Histogram calculated using DETX and DETY for each event in the final _common_clean file
| Quadrant A | 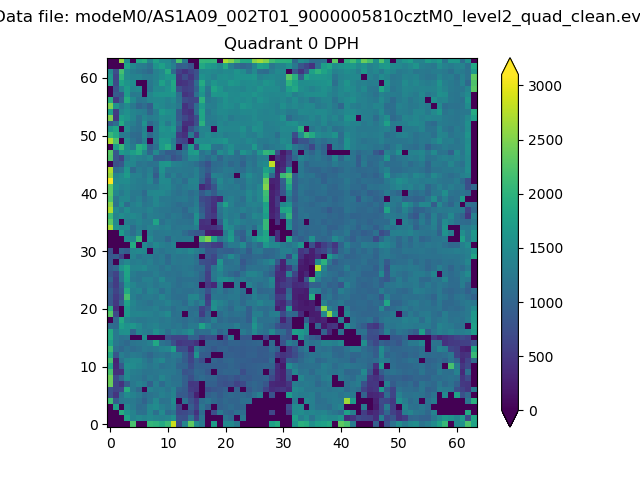 |
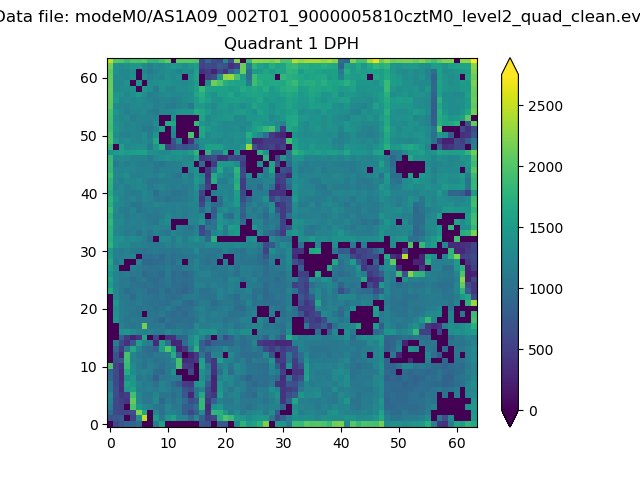 |
Quadrant B |
|---|---|---|---|
| Quadrant D |  |
 |
Quadrant C |
| Plot type | Count rate plots | Images |
|---|---|---|
| Comparison with Poisson distribution Blue bars denote a histogram of data divided into 1 sec bins. Red curve is a Poisson curve with rate = median count rate of data. |
 |
 |
| Quadrant-wise count rates Data is divided into 100 sec bins |
 |
|
| Module-wise count rates for Quadrant A Data is divided into 100 sec bins |
 |
 |
| Module-wise count rates for Quadrant B Data is divided into 100 sec bins |
 |
 |
| Module-wise count rates for Quadrant C Data is divided into 100 sec bins |
 |
 |
| Module-wise count rates for Quadrant D Data is divided into 100 sec bins |
 |
 |
| Parameter | Plot |
|---|---|
| CZT HV Monitor |  |
| D_VDD | 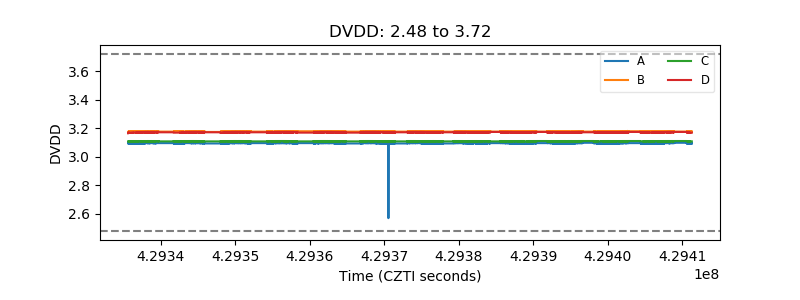 |
| Temperature 1 |  |
| Veto HV Monitor | 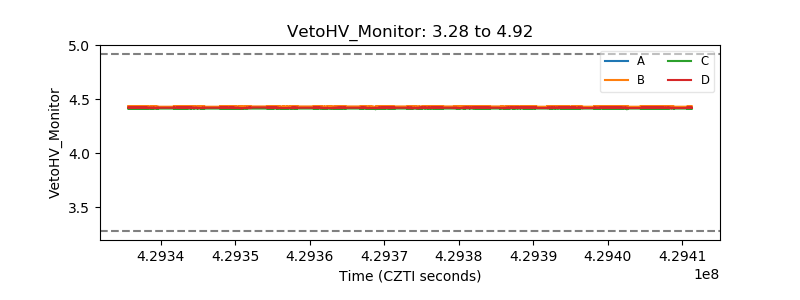 |
| Veto LLD | 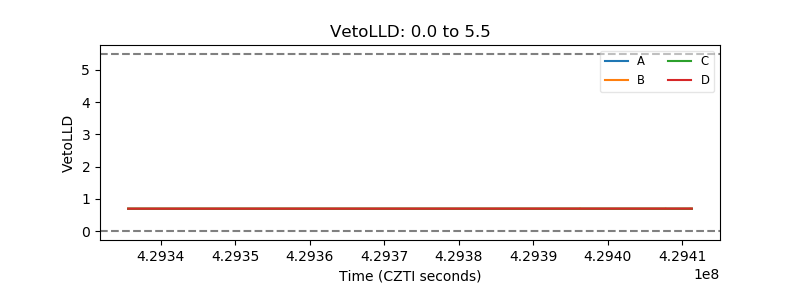 |
| Alpha Counter |  |
| _CPM_Rate | 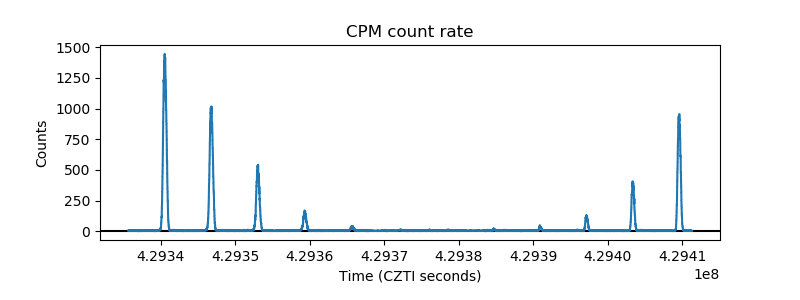 |
| CZT Counter |  |
| +2.5 Volts monitor |  |
| +5 Volts monitor |  |
| _ROLL_ROT |  |
| _Roll_DEC | 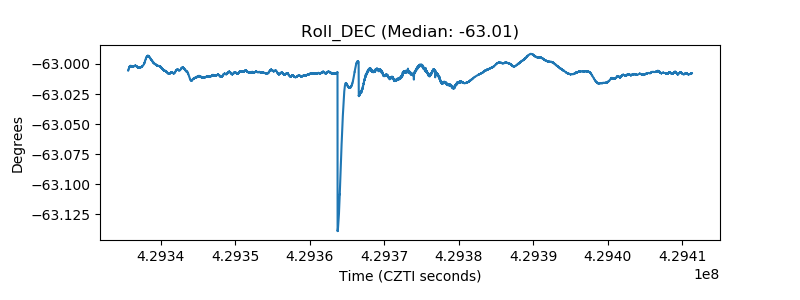 |
| _Roll_RA | 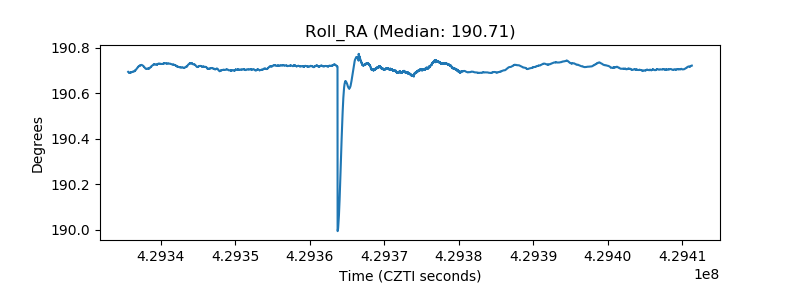 |
| Veto Counter |  |