| Param | Original file | Final file |
|---|---|---|
| Filename | modeM0/AS1A12_102T01_9000005812cztM0_level2.fits | modeM0/AS1A12_102T01_9000005812cztM0_level2_quad_clean.evt |
| Size (bytes) | 440,343,360 | 638,282,880 |
| Size | 419.9 MB | 608.7 MB |
| Events in quadrant A | 2,639,382 | 4,173,757 |
| Events in quadrant B | 2,514,046 | 4,149,205 |
| Events in quadrant C | 2,557,604 | 3,964,928 |
| Events in quadrant D | 2,180,012 | 3,600,950 |
| Mode M0 | |||
|---|---|---|---|
| Quadrant | BADHDUFLAG | Total packets | Discarded packets |
| A | 0 | 108370 | 0 |
| B | 0 | 105106 | 0 |
| C | 0 | 101159 | 0 |
| D | 0 | 145185 | 0 |
| Mode M9 | |||
|---|---|---|---|
| Quadrant | BADHDUFLAG | Total packets | Discarded packets |
| A | 0 | 188 | 0 |
| B | 0 | 188 | 0 |
| C | 0 | 188 | 0 |
| D | 0 | 188 | 0 |
| Mode SS | |||
|---|---|---|---|
| Quadrant | BADHDUFLAG | Total packets | Discarded packets |
| A | 0 | 1028 | 0 |
| B | 0 | 1028 | 0 |
| C | 0 | 1028 | 0 |
| D | 0 | 1028 | 0 |
| Quadrant | Total seconds | Saturated seconds | Saturation percentage |
|---|---|---|---|
| A | 50187 | 157 | 0.312830% |
| B | 50188 | 414 | 0.824898% |
| C | 50188 | 31 | 0.061768% |
| D | 50186 | 1492 | 2.972941% |
Noise dominated data is calculated using 1-second bins in cleaned event files. If a bin has >2000 counts, and if more than 50% of those come from <1% of pixels, then it is considered to be noise-dominated and hence unusable.
| Quadrant | # 1 sec bins | Bins with >0 counts | Bins with >2000 counts | High rate bins dominated by noise | Noise dominated (total time) | Noise dominated (detector-on time) | Marked lightcurve |
|---|---|---|---|---|---|---|---|
| A | 69063 | 50188 | 0 | 0 | 0.00% | 0.00% |  |
| B | 69064 | 50178 | 0 | 0 | 0.00% | 0.00% |  |
| C | 69064 | 50188 | 0 | 0 | 0.00% | 0.00% |  |
| D | 69064 | 50170 | 0 | 0 | 0.00% | 0.00% |  |
Top three noisy pixels from each quadrant. If the there are fewer than three noisy pixels in the level2.evt file, extra rows are filled as -1
| Pixel properties | Quadrant properties | ||||||
|---|---|---|---|---|---|---|---|
| Quadrant | DetID | PixID | Counts | Sigma | Mean | Median | Sigma |
| A | 9 | 19 | 2213 | 9.04 | 688 | 647 | 173.2 |
| A | 7 | 110 | 2192 | 8.92 | 688 | 647 | 173.2 |
| A | 0 | 29 | 2190 | 8.91 | 688 | 647 | 173.2 |
| B | 2 | 9 | 2209 | 12.11 | 665 | 636 | 129.9 |
| B | 3 | 80 | 1823 | 9.14 | 665 | 636 | 129.9 |
| B | 2 | 8 | 1809 | 9.03 | 665 | 636 | 129.9 |
| C | 1 | 81 | 2048 | 8.19 | 675 | 632 | 172.9 |
| C | 3 | 203 | 2034 | 8.11 | 675 | 632 | 172.9 |
| C | 3 | 202 | 2021 | 8.04 | 675 | 632 | 172.9 |
| D | 4 | 160 | 1701 | 6.74 | 624 | 567 | 168.2 |
| D | 6 | 38 | 1617 | 6.24 | 624 | 567 | 168.2 |
| D | 1 | 3 | 1593 | 6.1 | 624 | 567 | 168.2 |
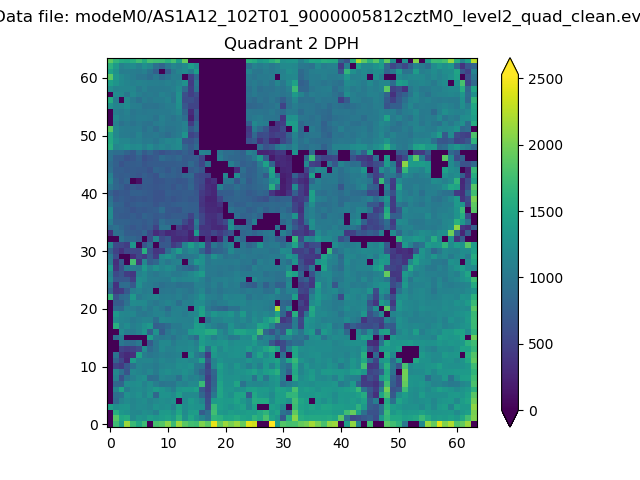
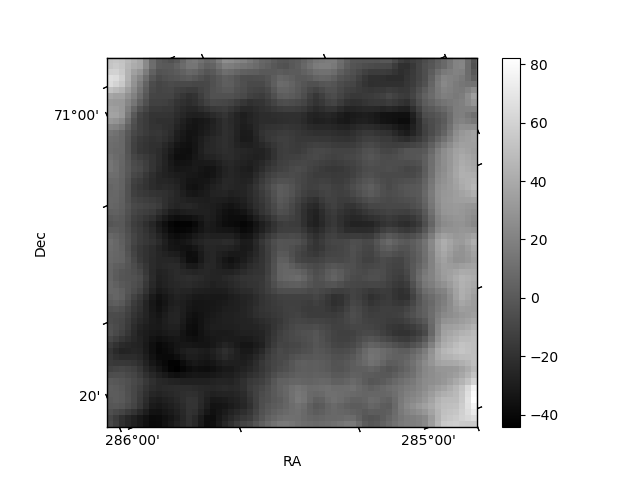
Histogram calculated using DETX and DETY for each event in the final _common_clean file
| Quadrant A |  |
 |
Quadrant B |
|---|---|---|---|
| Quadrant D | 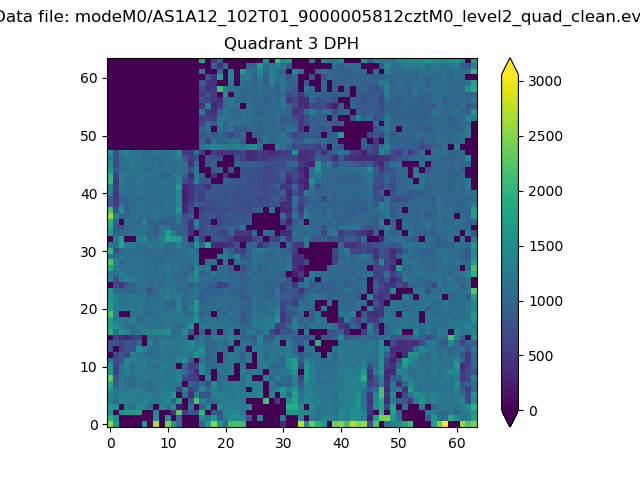 |
 |
Quadrant C |
| Plot type | Count rate plots | Images |
|---|---|---|
| Comparison with Poisson distribution Blue bars denote a histogram of data divided into 1 sec bins. Red curve is a Poisson curve with rate = median count rate of data. |
 |
 |
| Quadrant-wise count rates Data is divided into 100 sec bins |
 |
|
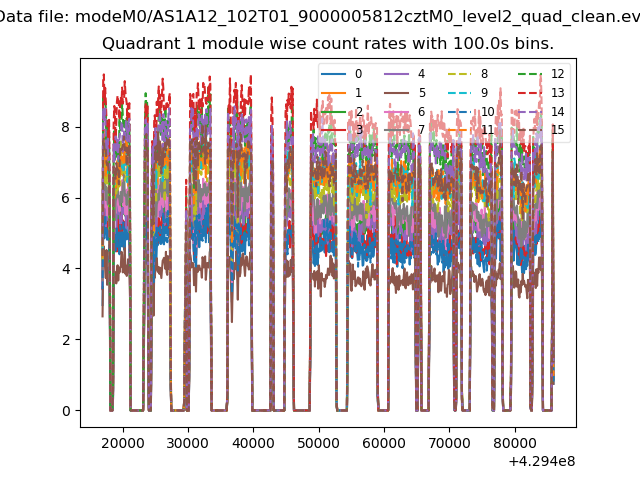
| Module-wise count rates for Quadrant A Data is divided into 100 sec bins |
 |
 |
| Module-wise count rates for Quadrant B Data is divided into 100 sec bins |
 |
 |
| Module-wise count rates for Quadrant C Data is divided into 100 sec bins |
 |
 |
| Module-wise count rates for Quadrant D Data is divided into 100 sec bins |
 |
 |
| Parameter | Plot |
|---|---|
| CZT HV Monitor | 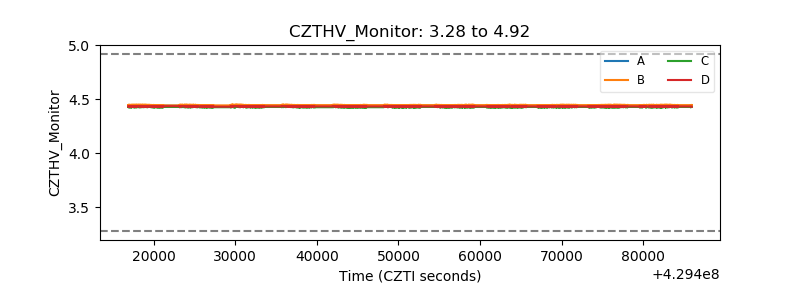 |
| D_VDD | 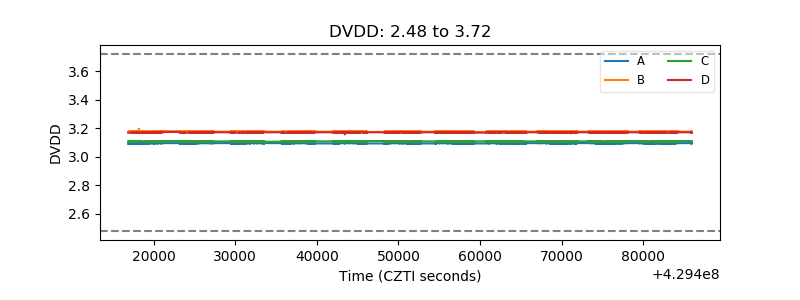 |
| Temperature 1 |  |
| Veto HV Monitor |  |
| Veto LLD |  |
| Alpha Counter |  |
| _CPM_Rate |  |
| CZT Counter | 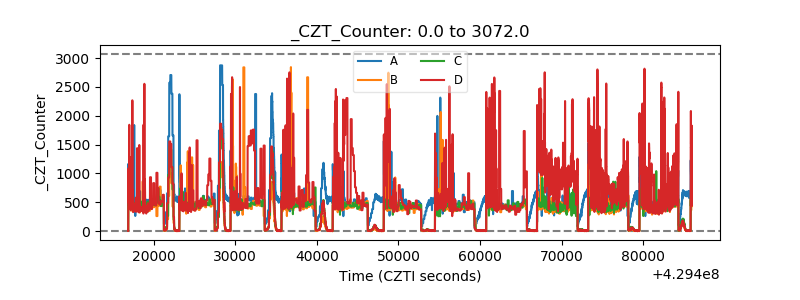 |
| +2.5 Volts monitor |  |
| +5 Volts monitor |  |
| _ROLL_ROT | 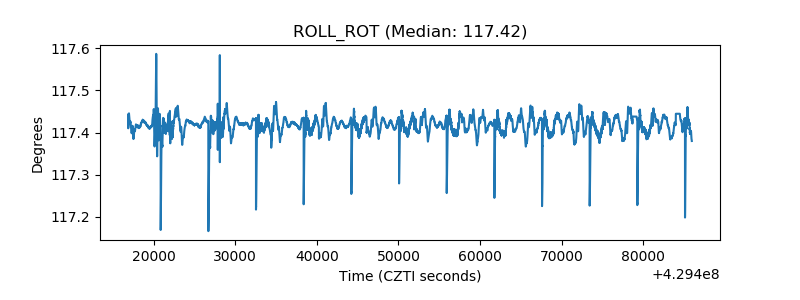 |
| _Roll_DEC |  |
| _Roll_RA | 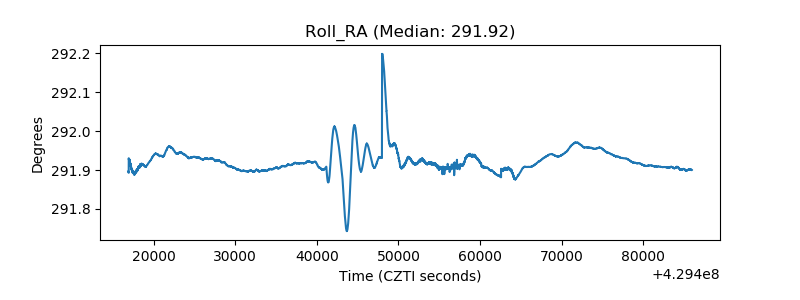 |
| Veto Counter |  |