| Param | Original file | Final file |
|---|---|---|
| Filename | modeM0/AS1C07_001T10_9000005814cztM0_level2.fits | modeM0/AS1C07_001T10_9000005814cztM0_level2_quad_clean.evt |
| Size (bytes) | 715,599,360 | 1,045,422,720 |
| Size | 682.4 MB | 997.0 MB |
| Events in quadrant A | 4,291,496 | 6,858,230 |
| Events in quadrant B | 4,076,246 | 6,778,591 |
| Events in quadrant C | 4,152,026 | 6,530,001 |
| Events in quadrant D | 3,558,610 | 5,906,279 |
| Mode M0 | |||
|---|---|---|---|
| Quadrant | BADHDUFLAG | Total packets | Discarded packets |
| A | 0 | 176159 | 0 |
| B | 0 | 172820 | 0 |
| C | 0 | 165422 | 0 |
| D | 0 | 214356 | 0 |
| Mode M9 | |||
|---|---|---|---|
| Quadrant | BADHDUFLAG | Total packets | Discarded packets |
| A | 0 | 315 | 0 |
| B | 0 | 315 | 0 |
| C | 0 | 315 | 0 |
| D | 0 | 315 | 0 |
| Mode SS | |||
|---|---|---|---|
| Quadrant | BADHDUFLAG | Total packets | Discarded packets |
| A | 0 | 1668 | 0 |
| B | 0 | 1668 | 0 |
| C | 0 | 1668 | 0 |
| D | 0 | 1668 | 0 |
| Quadrant | Total seconds | Saturated seconds | Saturation percentage |
|---|---|---|---|
| A | 81578 | 200 | 0.245164% |
| B | 81578 | 723 | 0.886268% |
| C | 81572 | 83 | 0.101751% |
| D | 81575 | 2718 | 3.331903% |
Noise dominated data is calculated using 1-second bins in cleaned event files. If a bin has >2000 counts, and if more than 50% of those come from <1% of pixels, then it is considered to be noise-dominated and hence unusable.
| Quadrant | # 1 sec bins | Bins with >0 counts | Bins with >2000 counts | High rate bins dominated by noise | Noise dominated (total time) | Noise dominated (detector-on time) | Marked lightcurve |
|---|---|---|---|---|---|---|---|
| A | 113035 | 81577 | 0 | 0 | 0.00% | 0.00% | 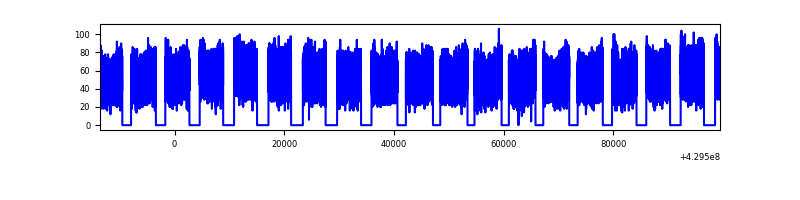 |
| B | 113035 | 81575 | 0 | 0 | 0.00% | 0.00% | 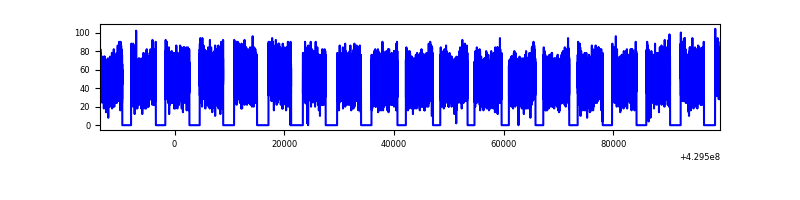 |
| C | 113035 | 81575 | 0 | 0 | 0.00% | 0.00% | 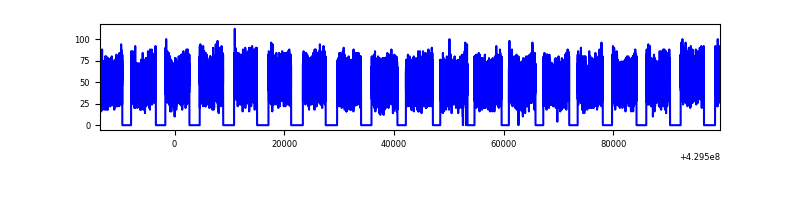 |
| D | 113035 | 81552 | 0 | 0 | 0.00% | 0.00% | 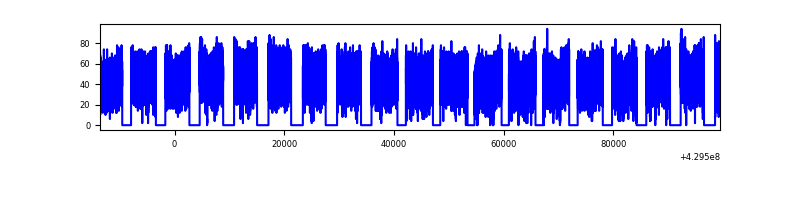 |
Top three noisy pixels from each quadrant. If the there are fewer than three noisy pixels in the level2.evt file, extra rows are filled as -1
| Pixel properties | Quadrant properties | ||||||
|---|---|---|---|---|---|---|---|
| Quadrant | DetID | PixID | Counts | Sigma | Mean | Median | Sigma |
| A | 7 | 110 | 3681 | 9.39 | 1119 | 1054 | 279.9 |
| A | 0 | 29 | 3587 | 9.05 | 1119 | 1054 | 279.9 |
| A | 9 | 19 | 3472 | 8.64 | 1119 | 1054 | 279.9 |
| B | 2 | 9 | 3541 | 12.08 | 1079 | 1032 | 207.6 |
| B | 3 | 80 | 3032 | 9.63 | 1079 | 1032 | 207.6 |
| B | 3 | 17 | 2846 | 8.74 | 1079 | 1032 | 207.6 |
| C | 1 | 81 | 3592 | 9.17 | 1096 | 1025 | 279.8 |
| C | 1 | 80 | 3355 | 8.33 | 1096 | 1025 | 279.8 |
| C | 3 | 202 | 3331 | 8.24 | 1096 | 1025 | 279.8 |
| D | 10 | 189 | 2733 | 6.61 | 1020 | 931 | 272.8 |
| D | 7 | 3 | 2688 | 6.44 | 1020 | 931 | 272.8 |
| D | 4 | 160 | 2630 | 6.23 | 1020 | 931 | 272.8 |
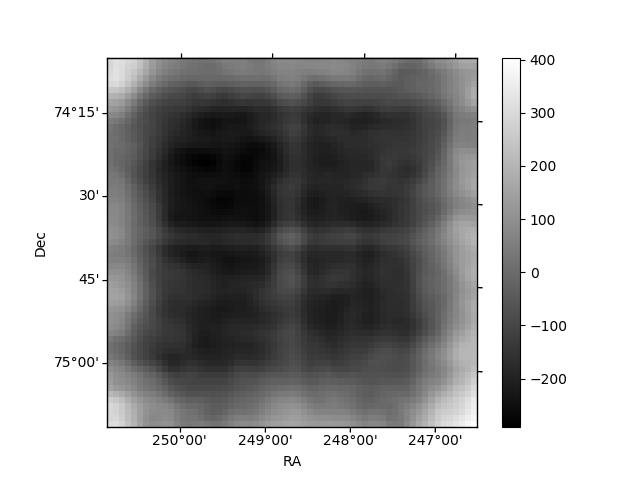
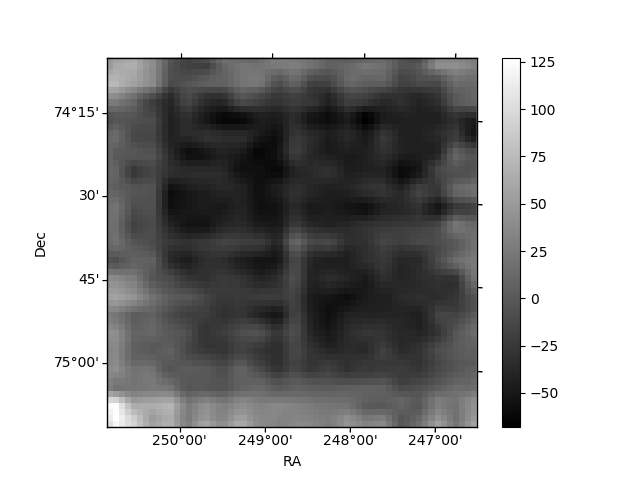
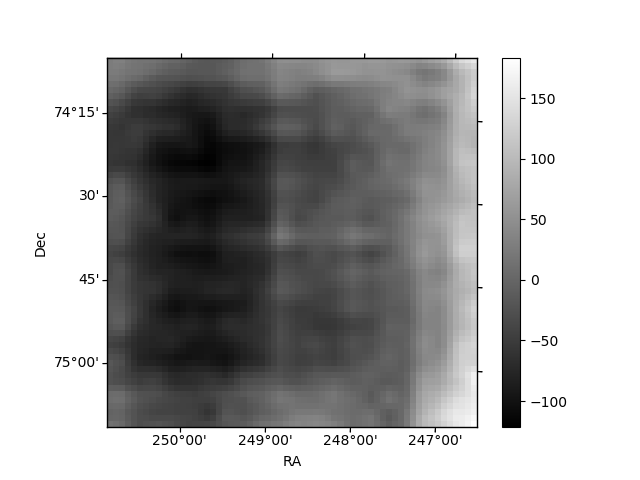
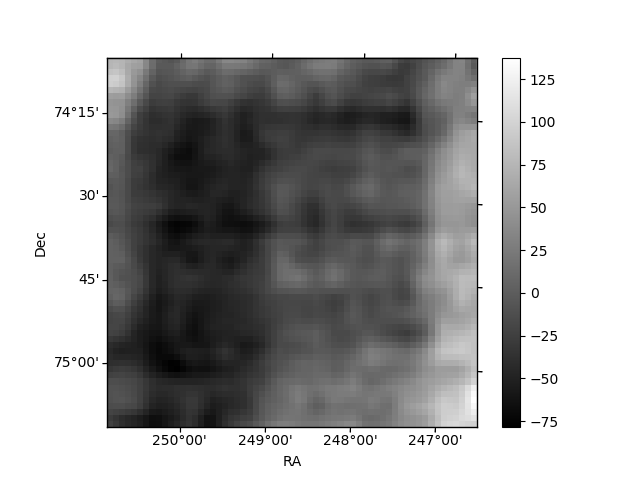
Histogram calculated using DETX and DETY for each event in the final _common_clean file
| Quadrant A | 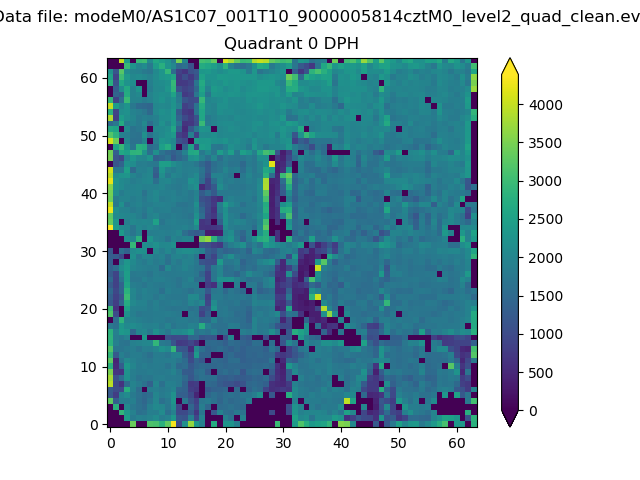 |
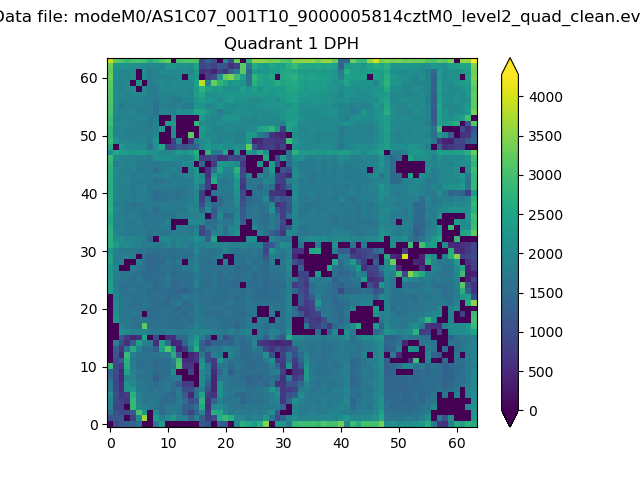 |
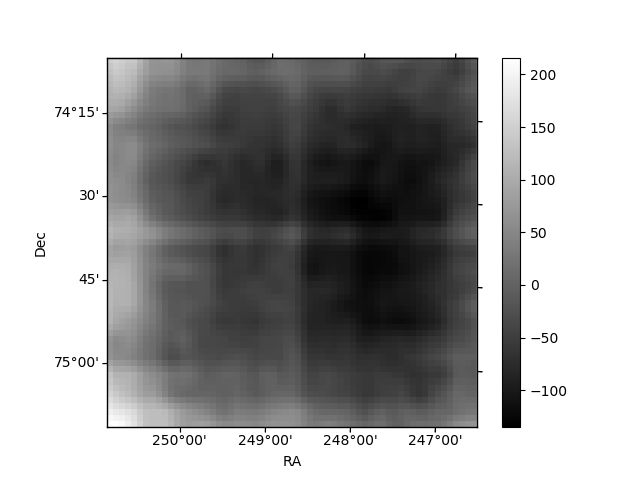
Quadrant B |
|---|---|---|---|
| Quadrant D | 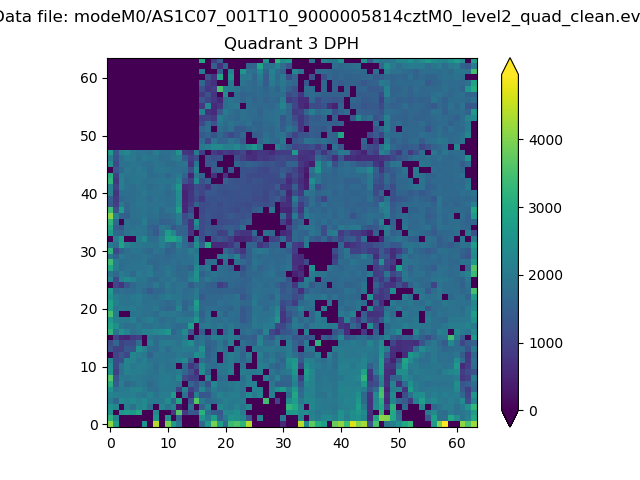 |
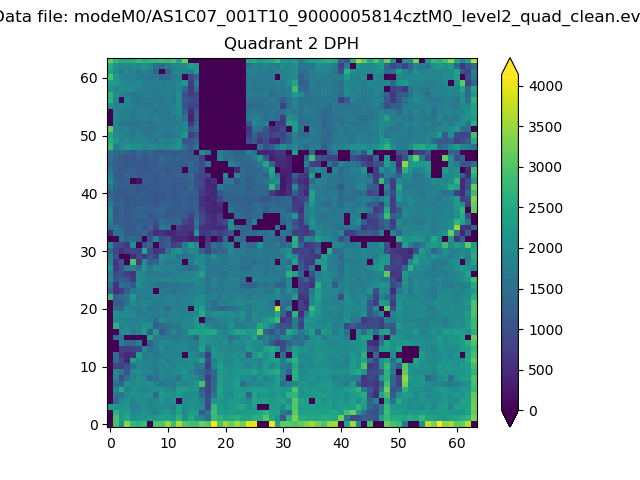 |
Quadrant C |
| Plot type | Count rate plots | Images |
|---|---|---|
| Comparison with Poisson distribution Blue bars denote a histogram of data divided into 1 sec bins. Red curve is a Poisson curve with rate = median count rate of data. |
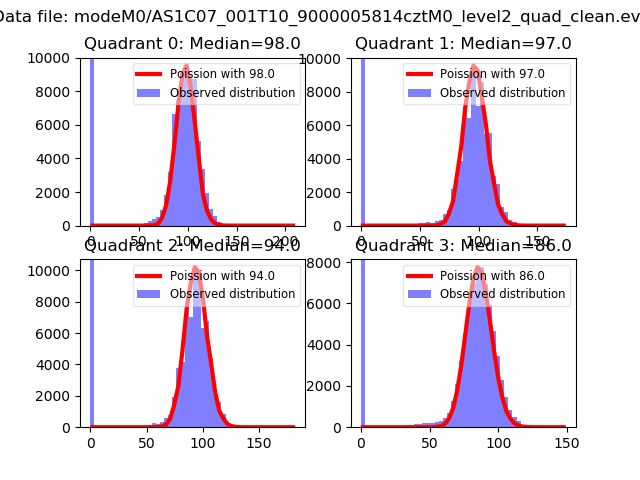 |
 |
| Quadrant-wise count rates Data is divided into 100 sec bins |
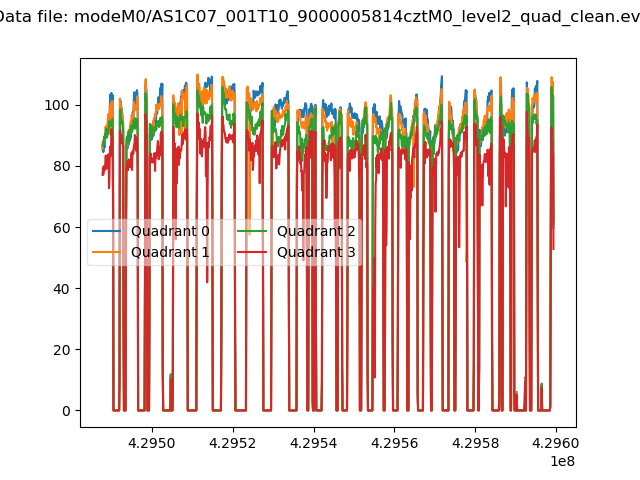 |
|
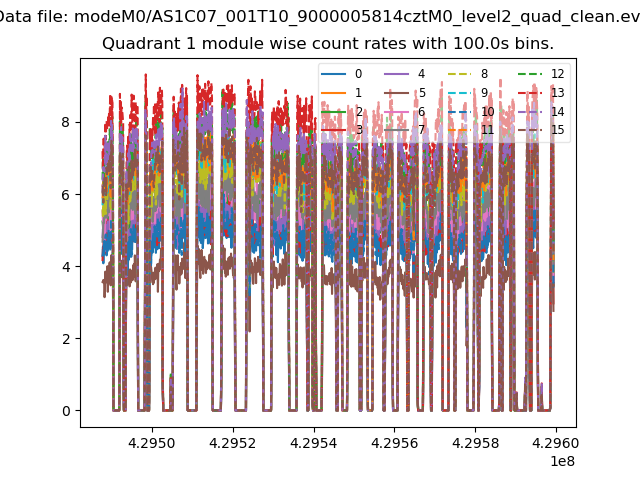
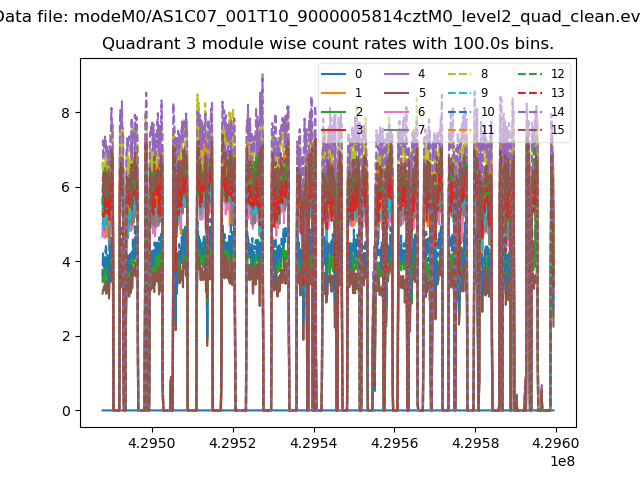
| Module-wise count rates for Quadrant A Data is divided into 100 sec bins |
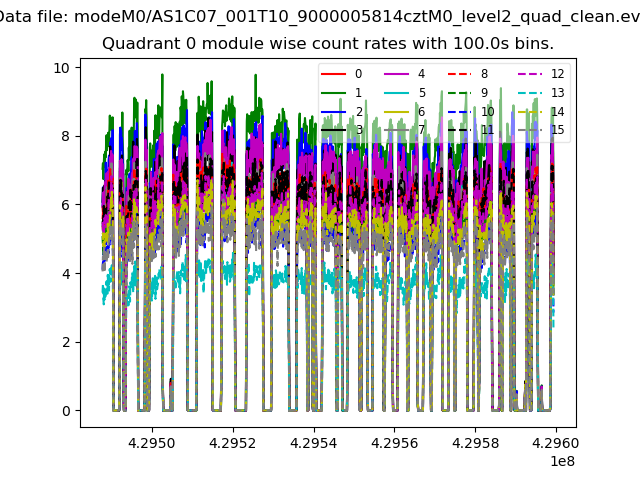 |
 |
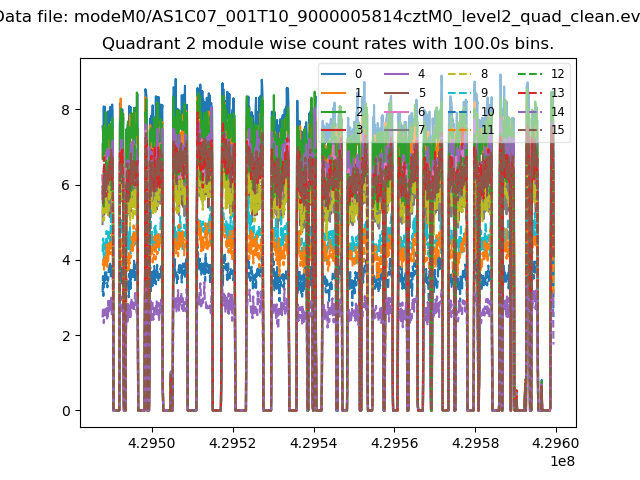
| Module-wise count rates for Quadrant B Data is divided into 100 sec bins |
 |
 |
| Module-wise count rates for Quadrant C Data is divided into 100 sec bins |
 |
 |
| Module-wise count rates for Quadrant D Data is divided into 100 sec bins |
 |
 |
| Parameter | Plot |
|---|---|
| CZT HV Monitor | 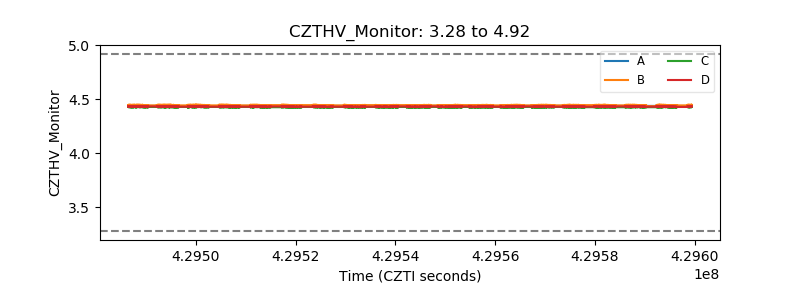 |
| D_VDD | 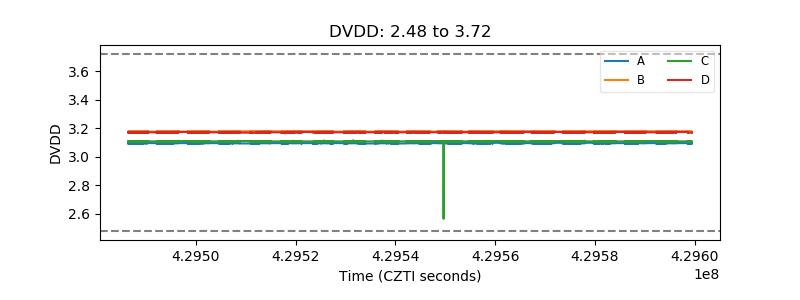 |
| Temperature 1 | 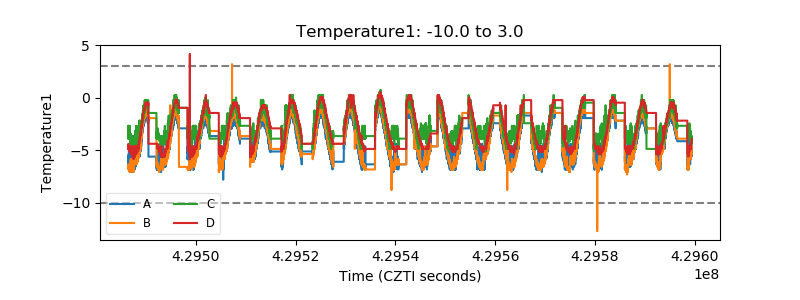 |
| Veto HV Monitor | 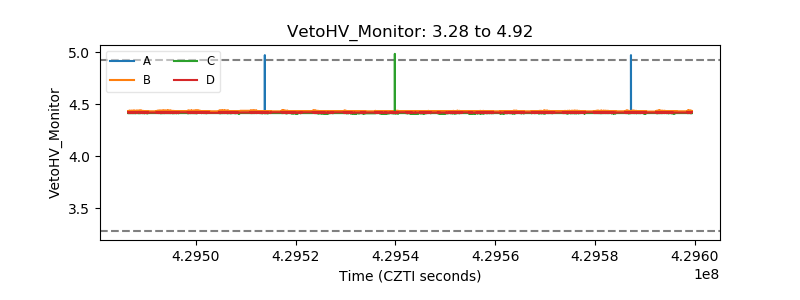 |
| Veto LLD | 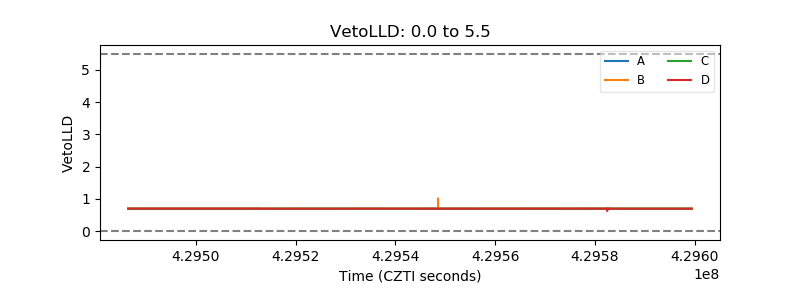 |
| Alpha Counter | 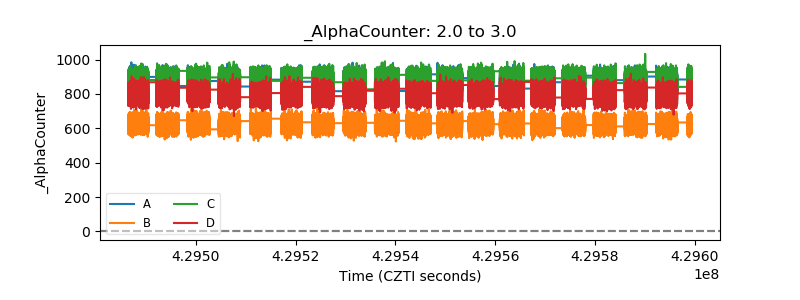 |
| _CPM_Rate | 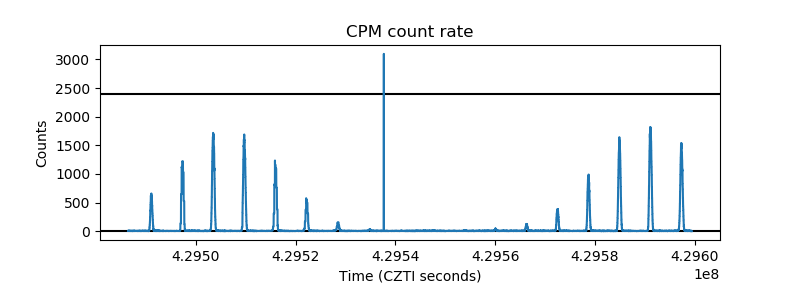 |
| CZT Counter | 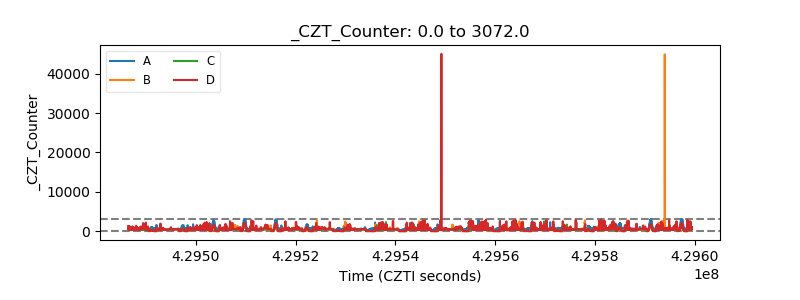 |
| +2.5 Volts monitor | 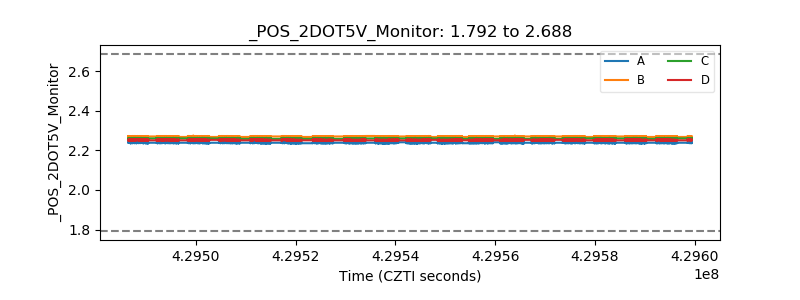 |
| +5 Volts monitor | 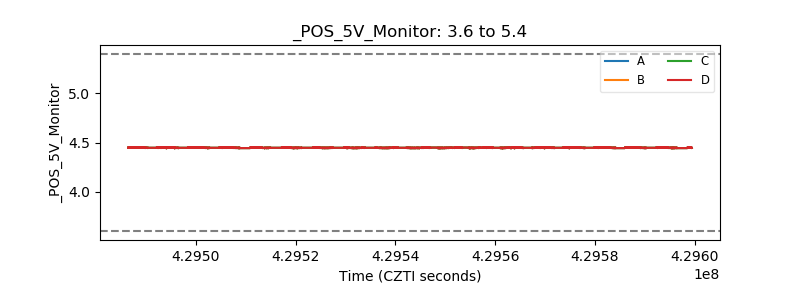 |
| _ROLL_ROT | 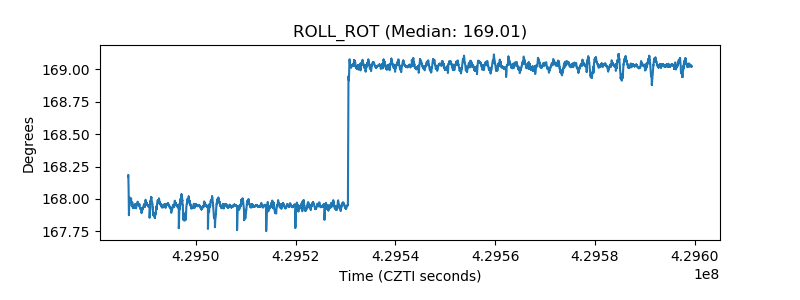 |
| _Roll_DEC | 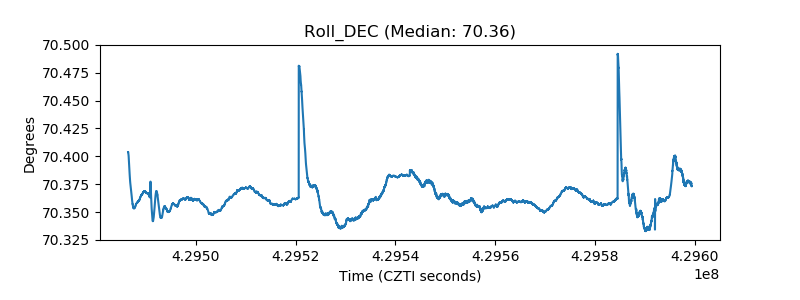 |
| _Roll_RA | 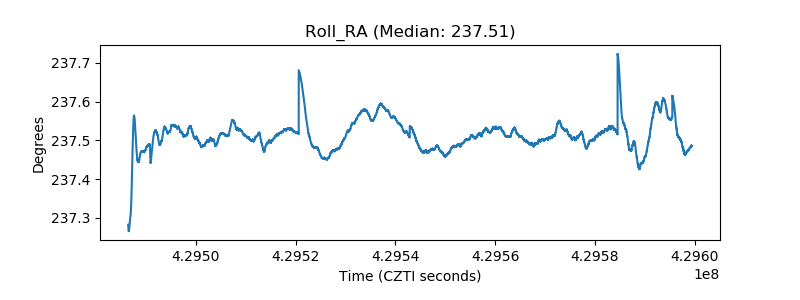 |
| Veto Counter | 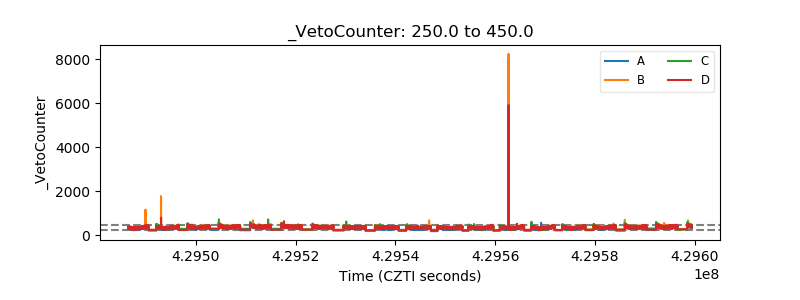 |