| Param | Original file | Final file |
|---|---|---|
| Filename | modeM0/AS1A05_013T01_9000005822cztM0_level2.fits | modeM0/AS1A05_013T01_9000005822cztM0_level2_quad_clean.evt |
| Size (bytes) | 5,447,436,480 | 6,003,429,120 |
| Size | 5.1 GB | 5.6 GB |
| Events in quadrant A | 32,793,610 | 36,943,463 |
| Events in quadrant B | 31,166,948 | 35,995,418 |
| Events in quadrant C | 31,691,514 | 35,149,255 |
| Events in quadrant D | 27,556,164 | 31,994,505 |
| Mode M0 | |||
|---|---|---|---|
| Quadrant | BADHDUFLAG | Total packets | Discarded packets |
| A | 0 | 1384326 | 0 |
| B | 0 | 1350694 | 0 |
| C | 0 | 1451934 | 0 |
| D | 0 | 1545213 | 0 |
| Mode M9 | |||
|---|---|---|---|
| Quadrant | BADHDUFLAG | Total packets | Discarded packets |
| A | 0 | 2299 | 0 |
| B | 0 | 2299 | 0 |
| C | 0 | 2299 | 0 |
| D | 0 | 2299 | 0 |
| Mode SS | |||
|---|---|---|---|
| Quadrant | BADHDUFLAG | Total packets | Discarded packets |
| A | 0 | 12382 | 0 |
| B | 0 | 12478 | 0 |
| C | 0 | 12478 | 0 |
| D | 0 | 12477 | 0 |
| Quadrant | Total seconds | Saturated seconds | Saturation percentage |
|---|---|---|---|
| A | 609741 | 5921 | 0.971068% |
| B | 609745 | 11353 | 1.861926% |
| C | 609758 | 16935 | 2.777331% |
| D | 609736 | 24920 | 4.087015% |
Noise dominated data is calculated using 1-second bins in cleaned event files. If a bin has >2000 counts, and if more than 50% of those come from <1% of pixels, then it is considered to be noise-dominated and hence unusable.
| Quadrant | # 1 sec bins | Bins with >0 counts | Bins with >2000 counts | High rate bins dominated by noise | Noise dominated (total time) | Noise dominated (detector-on time) | Marked lightcurve |
|---|---|---|---|---|---|---|---|
| A | 851970 | 609738 | 0 | 0 | 0.00% | 0.00% |  |
| B | 851970 | 609330 | 0 | 0 | 0.00% | 0.00% |  |
| C | 851970 | 609221 | 0 | 0 | 0.00% | 0.00% |  |
| D | 851970 | 609054 | 0 | 0 | 0.00% | 0.00% |  |
Top three noisy pixels from each quadrant. If the there are fewer than three noisy pixels in the level2.evt file, extra rows are filled as -1
| Pixel properties | Quadrant properties | ||||||
|---|---|---|---|---|---|---|---|
| Quadrant | DetID | PixID | Counts | Sigma | Mean | Median | Sigma |
| A | 0 | 29 | 26972 | 8.88 | 8573 | 8021 | 2133.2 |
| A | 9 | 19 | 26900 | 8.85 | 8573 | 8021 | 2133.2 |
| A | 7 | 110 | 26755 | 8.78 | 8573 | 8021 | 2133.2 |
| B | 2 | 9 | 27158 | 12.3 | 8262 | 7892 | 1565.9 |
| B | 3 | 80 | 22628 | 9.41 | 8262 | 7892 | 1565.9 |
| B | 2 | 8 | 22093 | 9.07 | 8262 | 7892 | 1565.9 |
| C | 1 | 81 | 26585 | 8.85 | 8394 | 7875 | 2114.6 |
| C | 1 | 80 | 25195 | 8.19 | 8394 | 7875 | 2114.6 |
| C | 3 | 202 | 25116 | 8.15 | 8394 | 7875 | 2114.6 |
| D | 7 | 3 | 20521 | 6.33 | 7903 | 7184 | 2107.5 |
| D | 10 | 189 | 20482 | 6.31 | 7903 | 7184 | 2107.5 |
| D | 4 | 160 | 20328 | 6.24 | 7903 | 7184 | 2107.5 |
Histogram calculated using DETX and DETY for each event in the final _common_clean file
| Quadrant A |  |
 |
Quadrant B |
|---|---|---|---|
| Quadrant D | 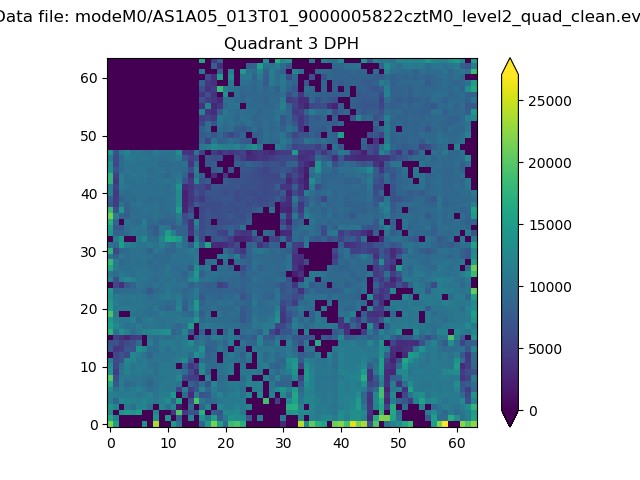 |
 |
Quadrant C |
| Plot type | Count rate plots | Images |
|---|---|---|
| Comparison with Poisson distribution Blue bars denote a histogram of data divided into 1 sec bins. Red curve is a Poisson curve with rate = median count rate of data. |
 |
 |
| Quadrant-wise count rates Data is divided into 100 sec bins |
 |
|
| Module-wise count rates for Quadrant A Data is divided into 100 sec bins |
 |
 |
| Module-wise count rates for Quadrant B Data is divided into 100 sec bins |
 |
 |
| Module-wise count rates for Quadrant C Data is divided into 100 sec bins |
 |
 |
| Module-wise count rates for Quadrant D Data is divided into 100 sec bins |
 |
 |
| Parameter | Plot |
|---|---|
| CZT HV Monitor |  |
| D_VDD |  |
| Temperature 1 |  |
| Veto HV Monitor |  |
| Veto LLD |  |
| Alpha Counter |  |
| _CPM_Rate |  |
| CZT Counter |  |
| +2.5 Volts monitor |  |
| +5 Volts monitor |  |
| _ROLL_ROT |  |
| _Roll_DEC |  |
| _Roll_RA |  |
| Veto Counter |  |