| Param | Original file | Final file |
|---|---|---|
| Filename | modeM0/AS1C06_010T01_9000005824cztM0_level2.fits | modeM0/AS1C06_010T01_9000005824cztM0_level2_quad_clean.evt |
| Size (bytes) | 174,147,840 | 239,103,360 |
| Size | 166.1 MB | 228.0 MB |
| Events in quadrant A | 1,040,778 | 1,547,506 |
| Events in quadrant B | 973,516 | 1,475,790 |
| Events in quadrant C | 1,024,940 | 1,492,588 |
| Events in quadrant D | 890,348 | 1,381,517 |
| Mode M9 | |||
|---|---|---|---|
| Quadrant | BADHDUFLAG | Total packets | Discarded packets |
| A | 0 | 90 | 0 |
| B | 0 | 90 | 0 |
| C | 0 | 90 | 0 |
| D | 0 | 90 | 0 |
| Mode M0 | |||
|---|---|---|---|
| Quadrant | BADHDUFLAG | Total packets | Discarded packets |
| A | 0 | 43333 | 0 |
| B | 0 | 51910 | 0 |
| C | 0 | 45463 | 0 |
| D | 0 | 50468 | 0 |
| Mode SS | |||
|---|---|---|---|
| Quadrant | BADHDUFLAG | Total packets | Discarded packets |
| A | 0 | 402 | 0 |
| B | 0 | 402 | 0 |
| C | 0 | 402 | 0 |
| D | 0 | 402 | 0 |
| Quadrant | Total seconds | Saturated seconds | Saturation percentage |
|---|---|---|---|
| A | 19505 | 63 | 0.322994% |
| B | 19505 | 1197 | 6.136888% |
| C | 19505 | 189 | 0.968982% |
| D | 19505 | 522 | 2.676237% |
Noise dominated data is calculated using 1-second bins in cleaned event files. If a bin has >2000 counts, and if more than 50% of those come from <1% of pixels, then it is considered to be noise-dominated and hence unusable.
| Quadrant | # 1 sec bins | Bins with >0 counts | Bins with >2000 counts | High rate bins dominated by noise | Noise dominated (total time) | Noise dominated (detector-on time) | Marked lightcurve |
|---|---|---|---|---|---|---|---|
| A | 28620 | 19506 | 0 | 0 | 0.00% | 0.00% | 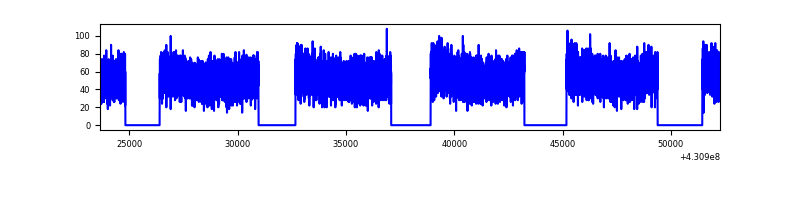 |
| B | 28620 | 19439 | 0 | 0 | 0.00% | 0.00% | 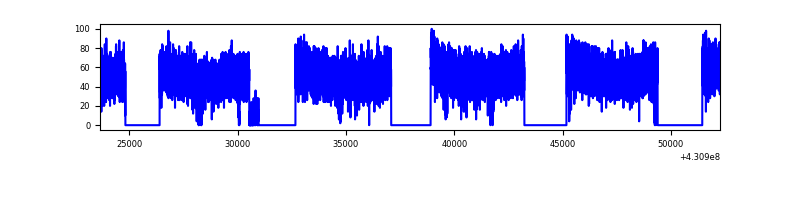 |
| C | 28620 | 19505 | 0 | 0 | 0.00% | 0.00% | 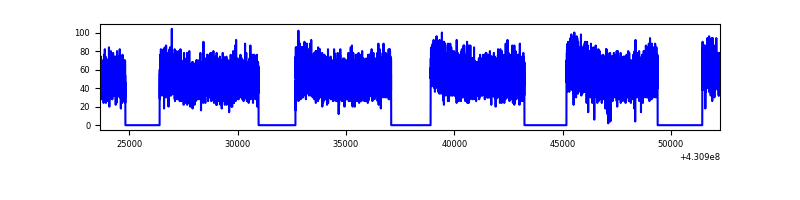 |
| D | 28620 | 19497 | 0 | 0 | 0.00% | 0.00% | 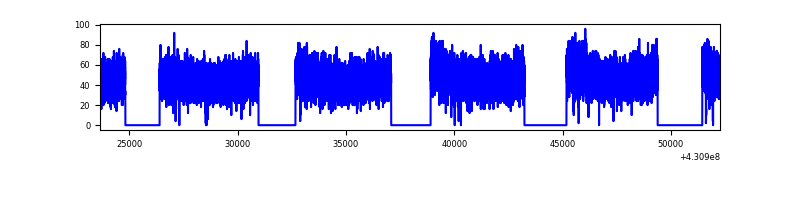 |
Top three noisy pixels from each quadrant. If the there are fewer than three noisy pixels in the level2.evt file, extra rows are filled as -1
| Pixel properties | Quadrant properties | ||||||
|---|---|---|---|---|---|---|---|
| Quadrant | DetID | PixID | Counts | Sigma | Mean | Median | Sigma |
| A | 9 | 19 | 894 | 8.98 | 272 | 256 | 71.1 |
| A | 7 | 110 | 840 | 8.22 | 272 | 256 | 71.1 |
| A | 0 | 29 | 805 | 7.73 | 272 | 256 | 71.1 |
| B | 2 | 9 | 824 | 11.09 | 258 | 247 | 52.0 |
| B | 3 | 80 | 710 | 8.9 | 258 | 247 | 52.0 |
| B | 5 | 128 | 689 | 8.49 | 258 | 247 | 52.0 |
| C | 1 | 81 | 897 | 9.11 | 271 | 255 | 70.5 |
| C | 1 | 80 | 829 | 8.14 | 271 | 255 | 70.5 |
| C | 1 | 65 | 786 | 7.53 | 271 | 255 | 70.5 |
| D | 10 | 189 | 691 | 6.67 | 253 | 232 | 68.8 |
| D | 6 | 38 | 686 | 6.6 | 253 | 232 | 68.8 |
| D | 3 | 14 | 663 | 6.27 | 253 | 232 | 68.8 |
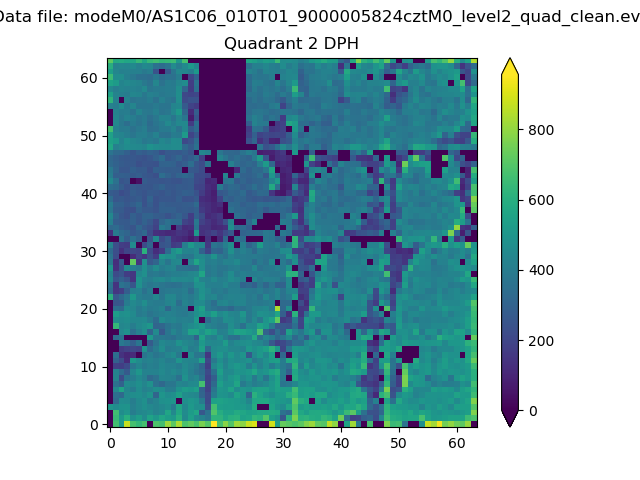
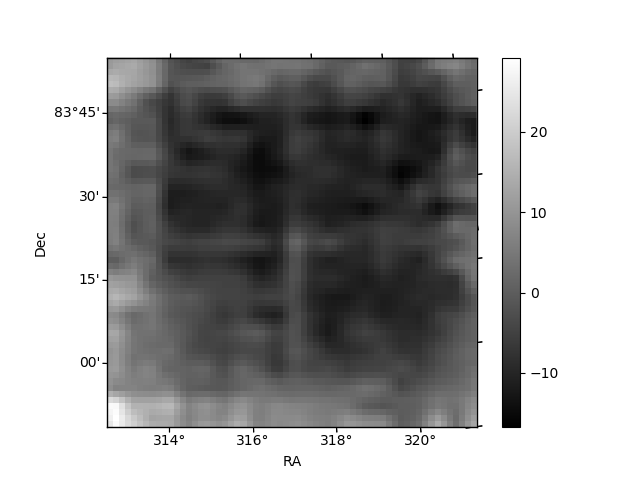
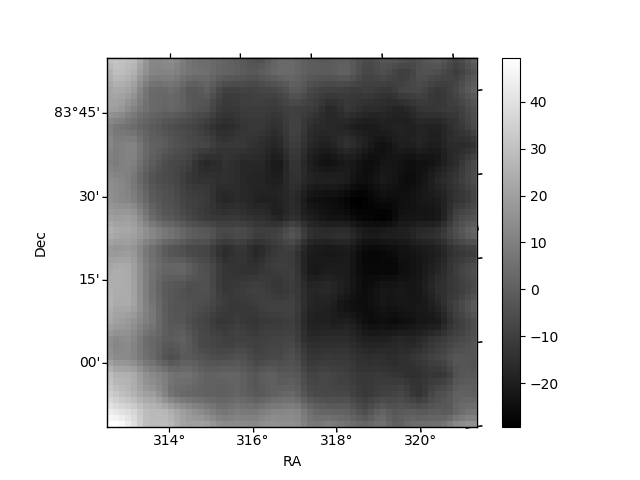
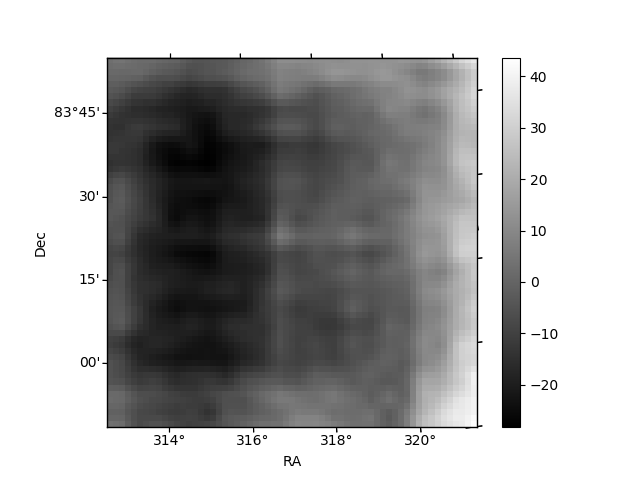
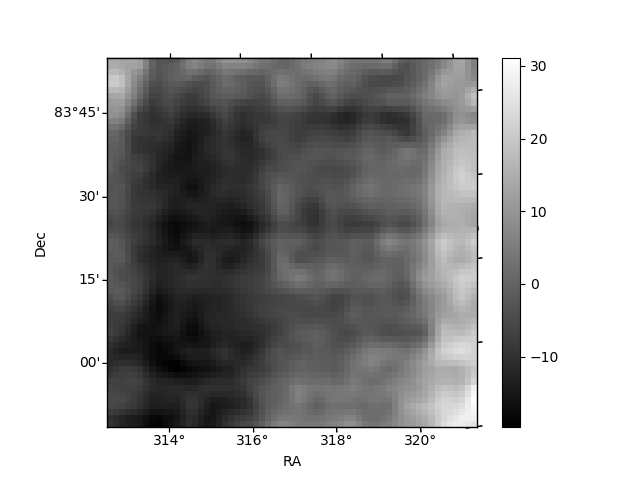
Histogram calculated using DETX and DETY for each event in the final _common_clean file
| Quadrant A | 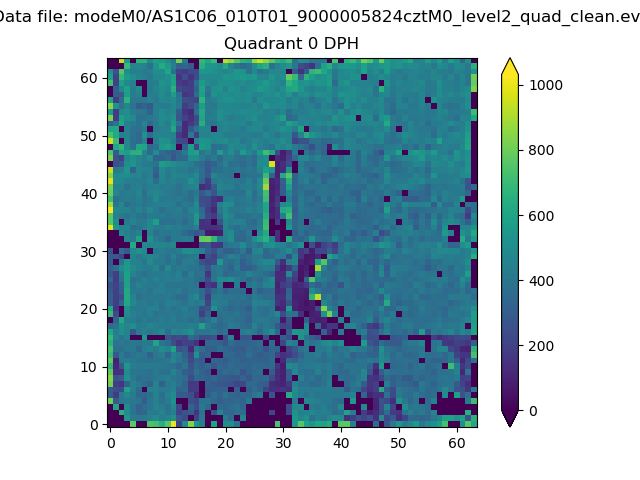 |
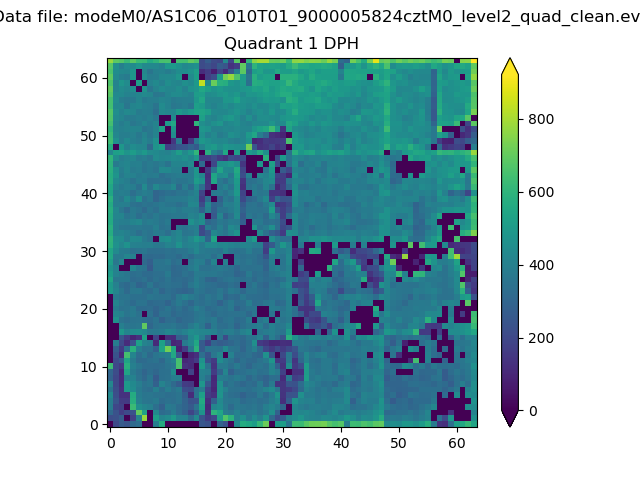 |
Quadrant B |
|---|---|---|---|
| Quadrant D | 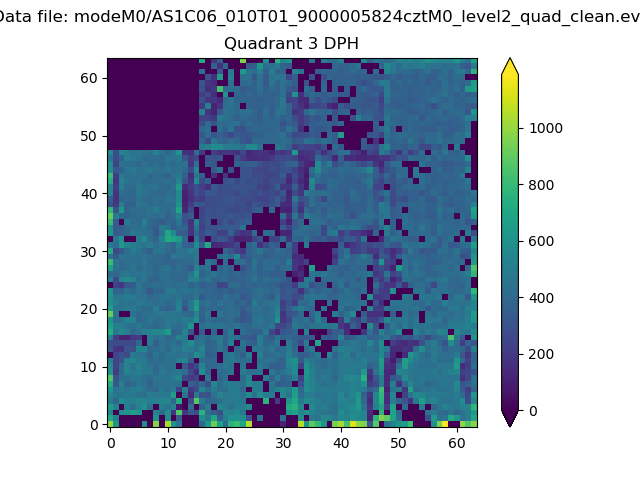 |
 |
Quadrant C |
| Plot type | Count rate plots | Images |
|---|---|---|
| Comparison with Poisson distribution Blue bars denote a histogram of data divided into 1 sec bins. Red curve is a Poisson curve with rate = median count rate of data. |
 |
 |
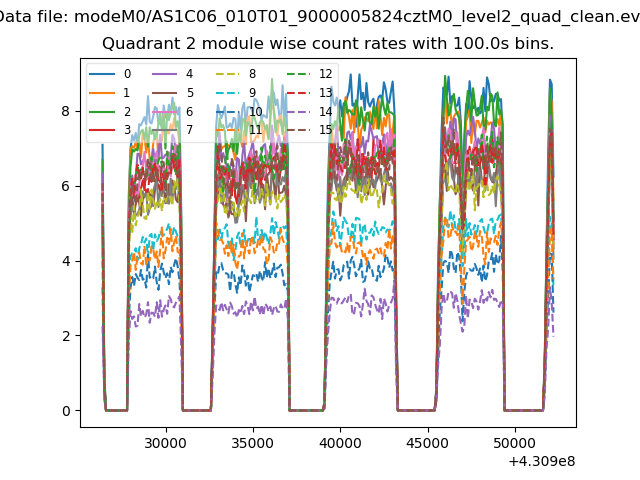
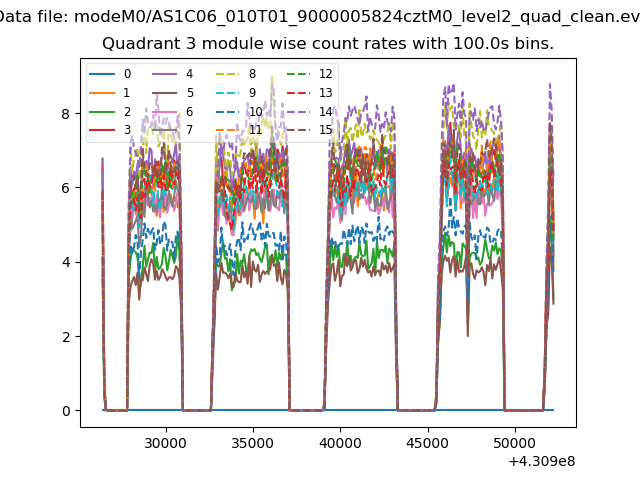
| Quadrant-wise count rates Data is divided into 100 sec bins |
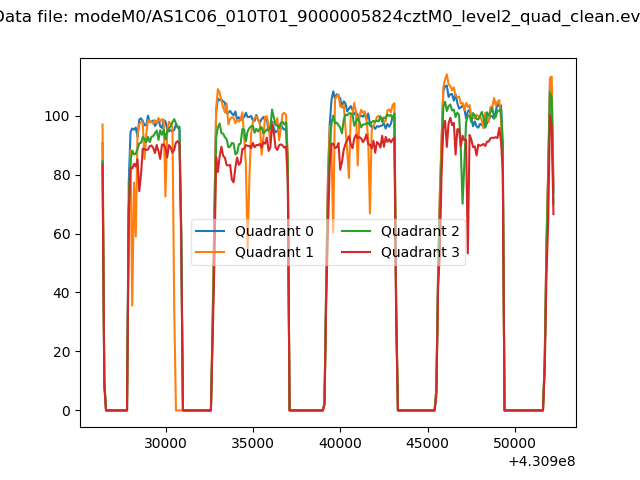 |
|
| Module-wise count rates for Quadrant A Data is divided into 100 sec bins |
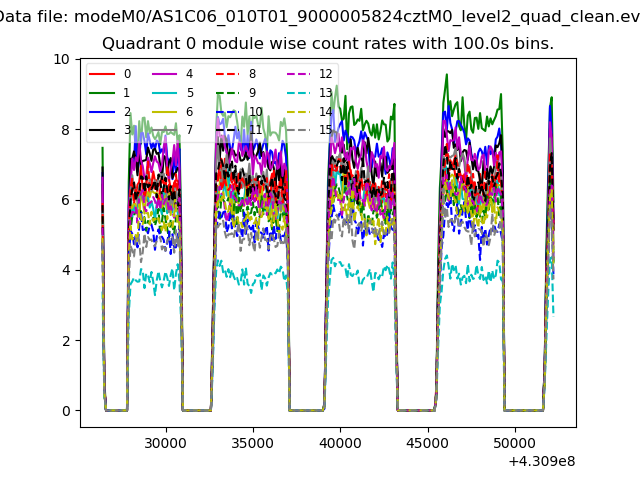 |
 |
| Module-wise count rates for Quadrant B Data is divided into 100 sec bins |
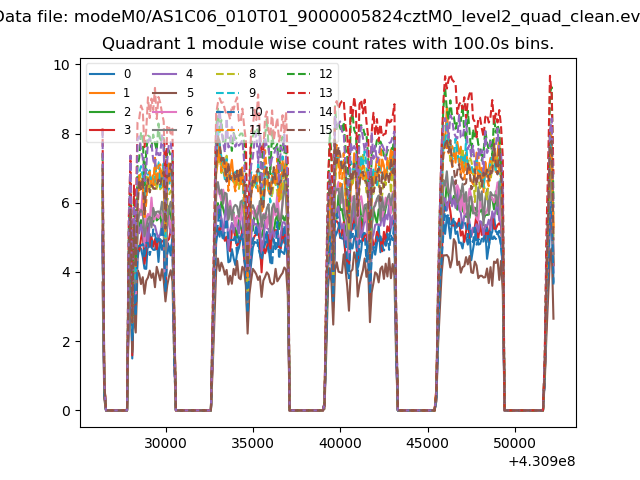 |
 |
| Module-wise count rates for Quadrant C Data is divided into 100 sec bins |
 |
 |
| Module-wise count rates for Quadrant D Data is divided into 100 sec bins |
 |
 |
| Parameter | Plot |
|---|---|
| CZT HV Monitor | 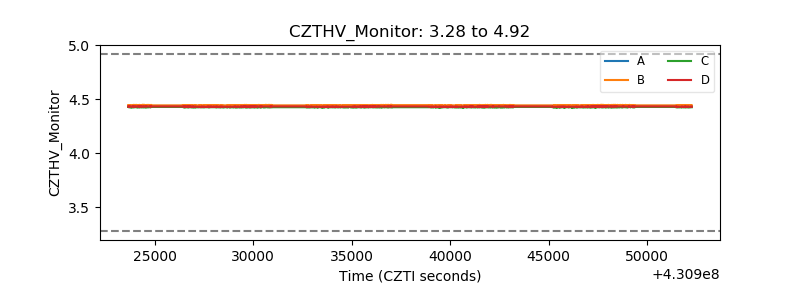 |
| D_VDD | 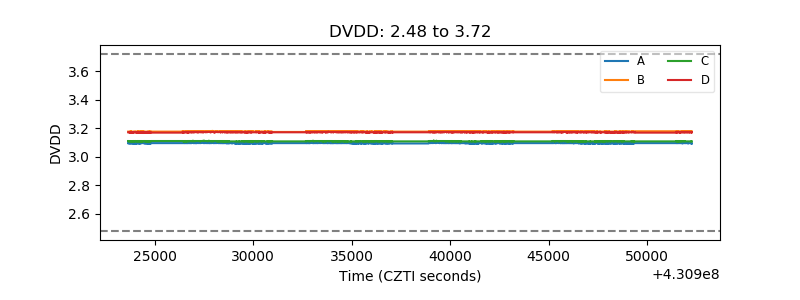 |
| Temperature 1 | 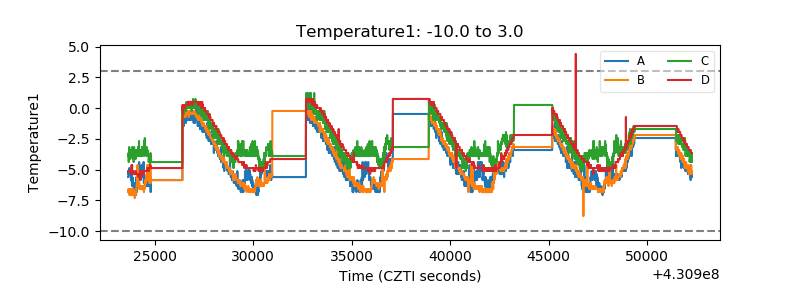 |
| Veto HV Monitor | 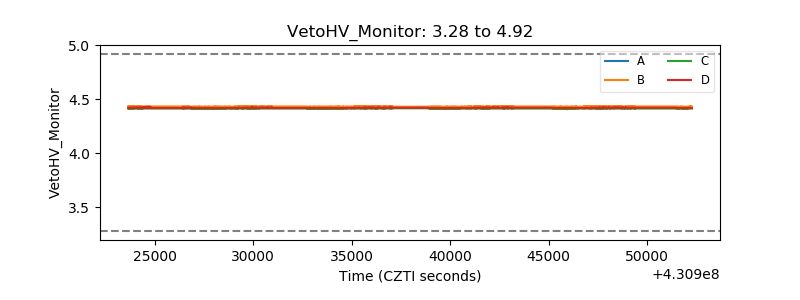 |
| Veto LLD | 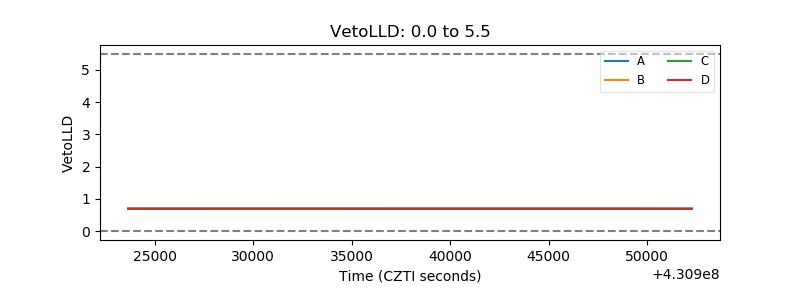 |
| Alpha Counter | 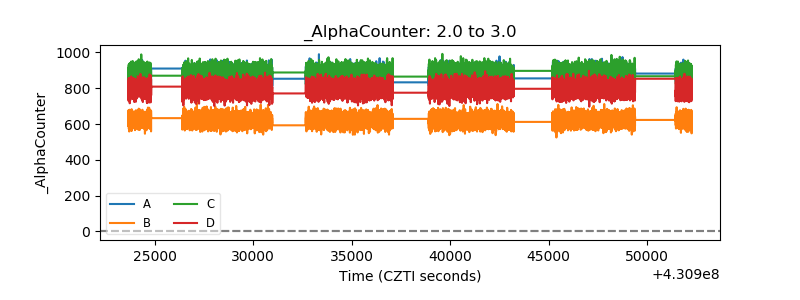 |
| _CPM_Rate | 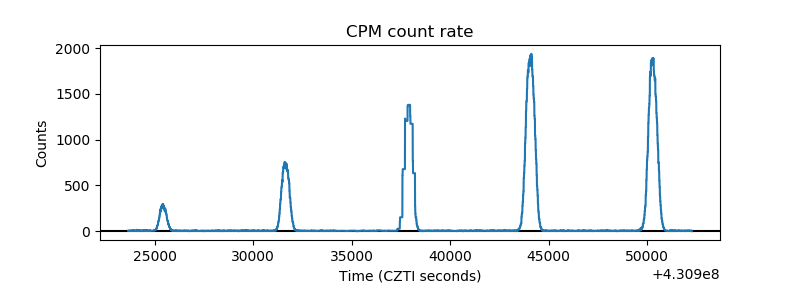 |
| CZT Counter |  |
| +2.5 Volts monitor | 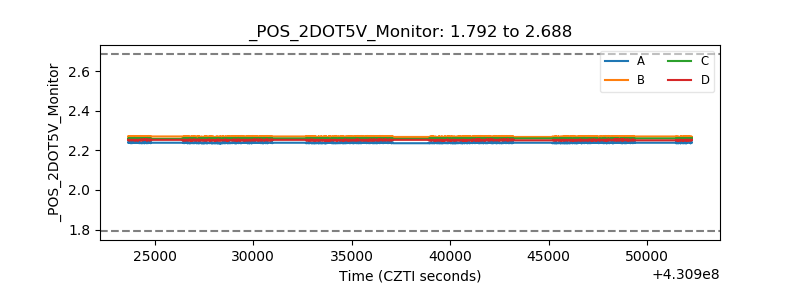 |
| +5 Volts monitor |  |
| _ROLL_ROT | 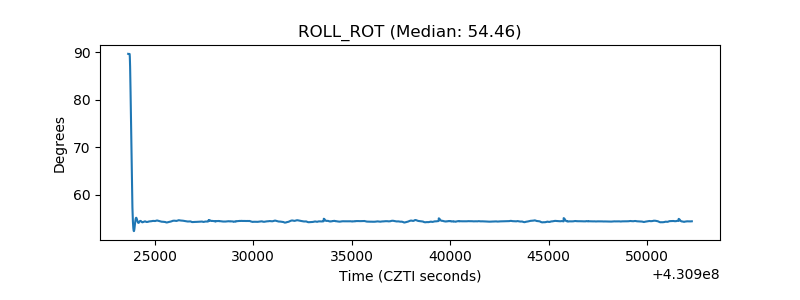 |
| _Roll_DEC | 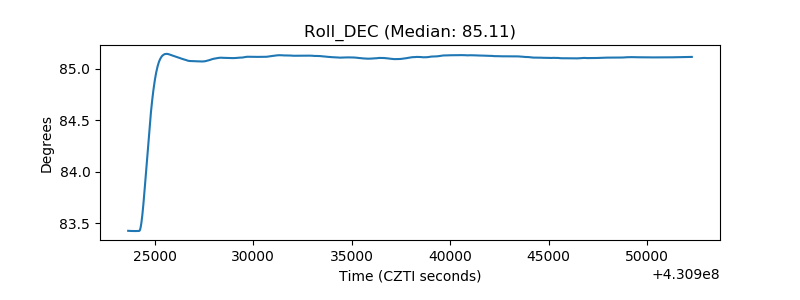 |
| _Roll_RA | 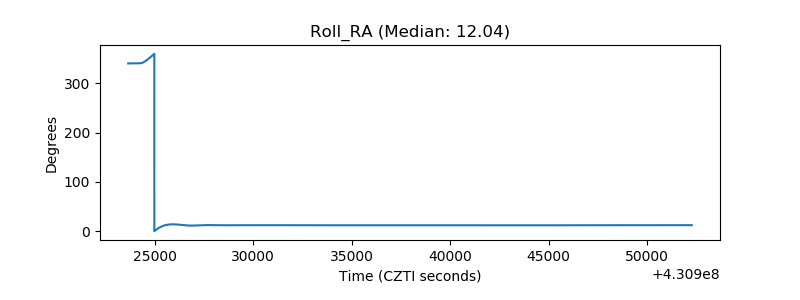 |
| Veto Counter | 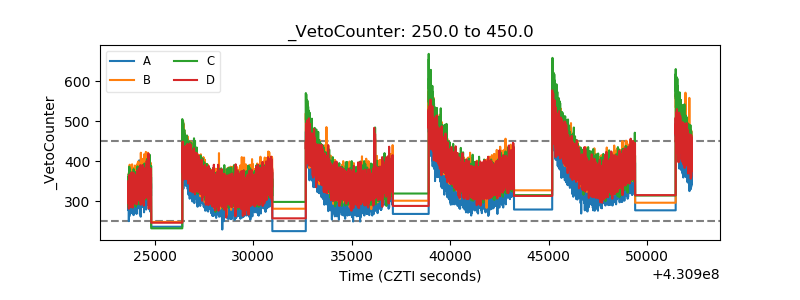 |