| Param | Original file | Final file |
|---|---|---|
| Filename | modeM0/AS1C07_001T12_9000005826cztM0_level2.fits | modeM0/AS1C07_001T12_9000005826cztM0_level2_quad_clean.evt |
| Size (bytes) | 632,304,000 | 1,011,916,800 |
| Size | 603.0 MB | 965.0 MB |
| Events in quadrant A | 3,756,710 | 6,757,421 |
| Events in quadrant B | 3,564,278 | 6,566,425 |
| Events in quadrant C | 3,668,656 | 6,416,891 |
| Events in quadrant D | 3,193,332 | 5,945,787 |
| Mode M0 | |||
|---|---|---|---|
| Quadrant | BADHDUFLAG | Total packets | Discarded packets |
| A | 0 | 159050 | 0 |
| B | 0 | 177620 | 0 |
| C | 0 | 161003 | 0 |
| D | 0 | 174240 | 0 |
| Mode SS | |||
|---|---|---|---|
| Quadrant | BADHDUFLAG | Total packets | Discarded packets |
| A | 0 | 1482 | 0 |
| B | 0 | 1482 | 0 |
| C | 0 | 1482 | 0 |
| D | 0 | 1482 | 0 |
| Mode M9 | |||
|---|---|---|---|
| Quadrant | BADHDUFLAG | Total packets | Discarded packets |
| A | 0 | 291 | 0 |
| B | 0 | 291 | 0 |
| C | 0 | 292 | 0 |
| D | 0 | 292 | 0 |
| Quadrant | Total seconds | Saturated seconds | Saturation percentage |
|---|---|---|---|
| A | 72397 | 335 | 0.462726% |
| B | 72397 | 2405 | 3.321961% |
| C | 72397 | 681 | 0.940647% |
| D | 72396 | 1698 | 2.345433% |
Noise dominated data is calculated using 1-second bins in cleaned event files. If a bin has >2000 counts, and if more than 50% of those come from <1% of pixels, then it is considered to be noise-dominated and hence unusable.
| Quadrant | # 1 sec bins | Bins with >0 counts | Bins with >2000 counts | High rate bins dominated by noise | Noise dominated (total time) | Noise dominated (detector-on time) | Marked lightcurve |
|---|---|---|---|---|---|---|---|
| A | 106628 | 72391 | 0 | 0 | 0.00% | 0.00% | 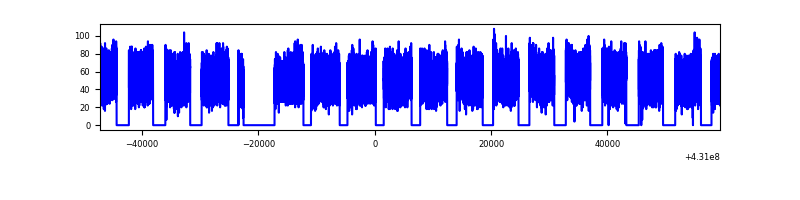 |
| B | 106629 | 72375 | 0 | 0 | 0.00% | 0.00% |  |
| C | 106628 | 72386 | 0 | 0 | 0.00% | 0.00% |  |
| D | 106629 | 72368 | 0 | 0 | 0.00% | 0.00% | 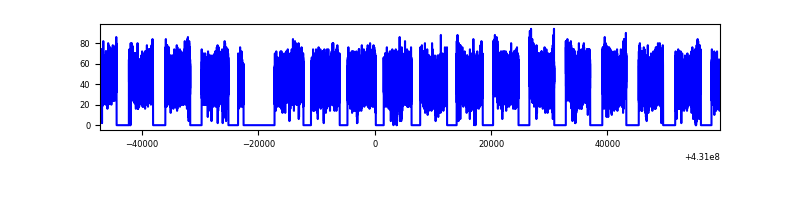 |
Top three noisy pixels from each quadrant. If the there are fewer than three noisy pixels in the level2.evt file, extra rows are filled as -1
| Pixel properties | Quadrant properties | ||||||
|---|---|---|---|---|---|---|---|
| Quadrant | DetID | PixID | Counts | Sigma | Mean | Median | Sigma |
| A | 0 | 29 | 3149 | 8.98 | 982 | 922 | 248.1 |
| A | 7 | 110 | 3108 | 8.81 | 982 | 922 | 248.1 |
| A | 9 | 19 | 3013 | 8.43 | 982 | 922 | 248.1 |
| B | 2 | 9 | 3133 | 12.39 | 943 | 903 | 180.0 |
| B | 3 | 80 | 2632 | 9.6 | 943 | 903 | 180.0 |
| B | 2 | 8 | 2559 | 9.2 | 943 | 903 | 180.0 |
| C | 1 | 81 | 3132 | 8.92 | 971 | 911 | 249.0 |
| C | 1 | 80 | 3016 | 8.45 | 971 | 911 | 249.0 |
| C | 3 | 202 | 2872 | 7.88 | 971 | 911 | 249.0 |
| D | 10 | 189 | 2447 | 6.56 | 914 | 834 | 245.7 |
| D | 6 | 38 | 2405 | 6.39 | 914 | 834 | 245.7 |
| D | 7 | 3 | 2398 | 6.37 | 914 | 834 | 245.7 |
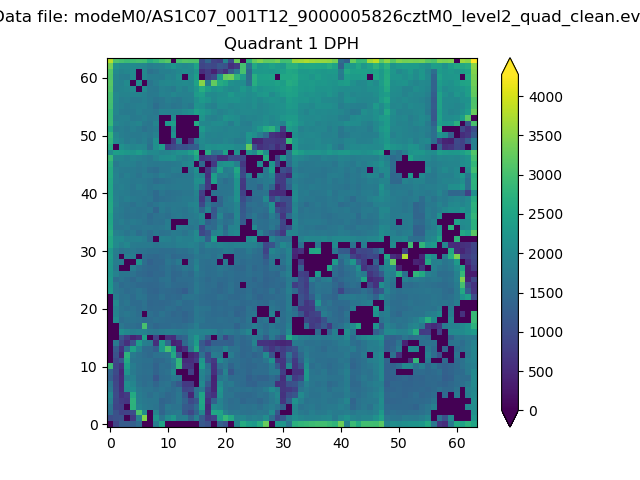
Histogram calculated using DETX and DETY for each event in the final _common_clean file
| Quadrant A |  |
 |
Quadrant B |
|---|---|---|---|
| Quadrant D | 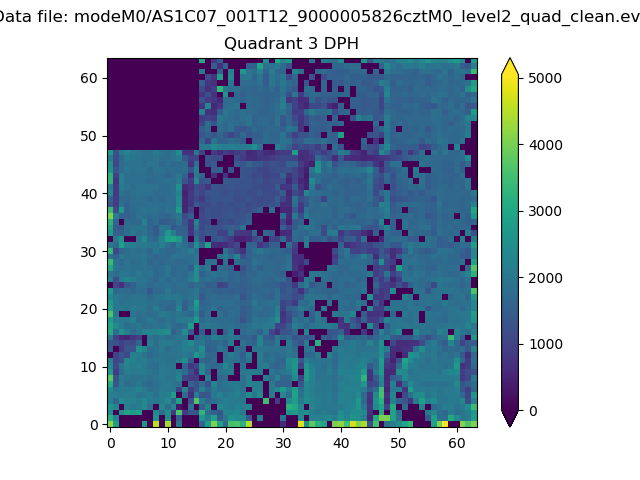 |
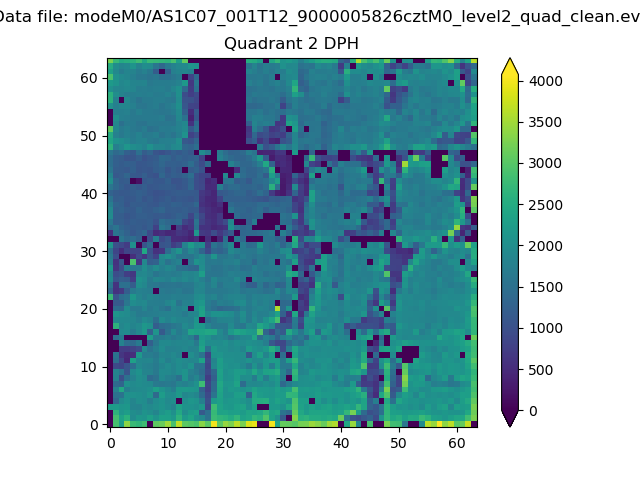 |
Quadrant C |
| Plot type | Count rate plots | Images |
|---|---|---|
| Comparison with Poisson distribution Blue bars denote a histogram of data divided into 1 sec bins. Red curve is a Poisson curve with rate = median count rate of data. |
 |
 |
| Quadrant-wise count rates Data is divided into 100 sec bins |
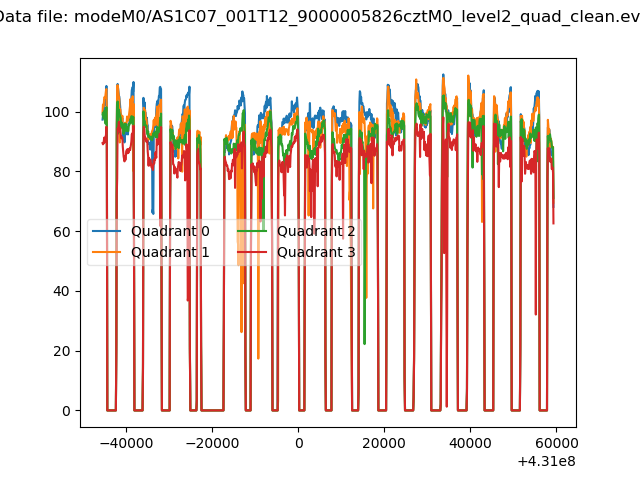 |
|
| Module-wise count rates for Quadrant A Data is divided into 100 sec bins |
 |
 |
| Module-wise count rates for Quadrant B Data is divided into 100 sec bins |
 |
 |
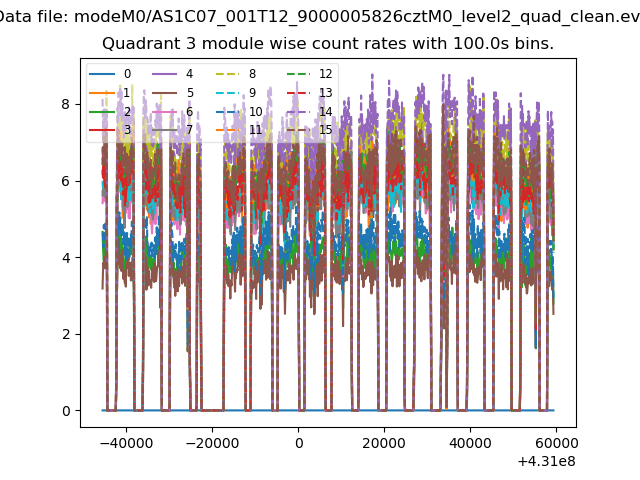
| Module-wise count rates for Quadrant C Data is divided into 100 sec bins |
 |
 |
| Module-wise count rates for Quadrant D Data is divided into 100 sec bins |
 |
 |
| Parameter | Plot |
|---|---|
| CZT HV Monitor |  |
| D_VDD | 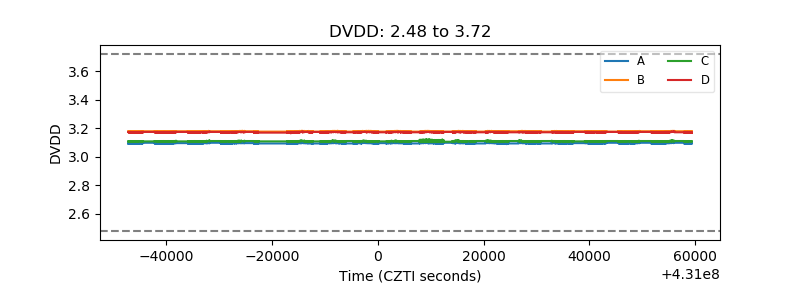 |
| Temperature 1 |  |
| Veto HV Monitor |  |
| Veto LLD | 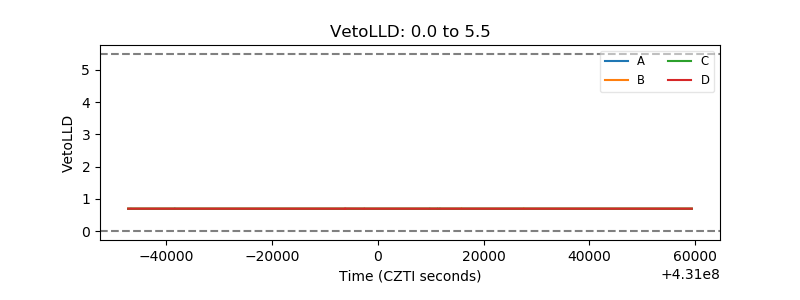 |
| Alpha Counter |  |
| _CPM_Rate |  |
| CZT Counter | 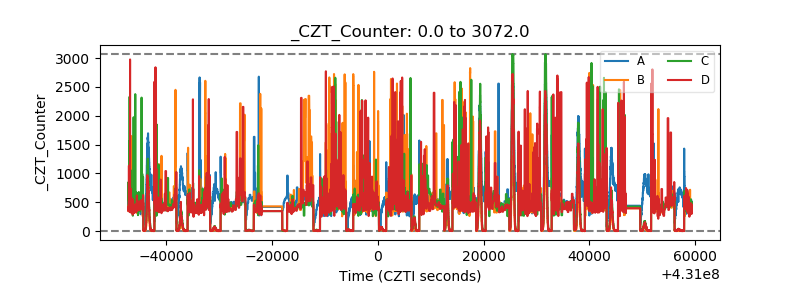 |
| +2.5 Volts monitor |  |
| +5 Volts monitor |  |
| _ROLL_ROT |  |
| _Roll_DEC |  |
| _Roll_RA |  |
| Veto Counter |  |