| Param | Original file | Final file |
|---|---|---|
| Filename | modeM0/AS1T05_138T01_9000005828cztM0_level2.fits | modeM0/AS1T05_138T01_9000005828cztM0_level2_quad_clean.evt |
| Size (bytes) | 1,857,168,000 | 2,120,722,560 |
| Size | 1.7 GB | 2.0 GB |
| Events in quadrant A | 11,087,750 | 12,748,156 |
| Events in quadrant B | 10,545,278 | 12,591,061 |
| Events in quadrant C | 10,950,036 | 13,287,645 |
| Events in quadrant D | 9,025,784 | 10,980,382 |
| Mode M0 | |||
|---|---|---|---|
| Quadrant | BADHDUFLAG | Total packets | Discarded packets |
| A | 0 | 493984 | 0 |
| B | 0 | 491870 | 0 |
| C | 0 | 497554 | 0 |
| D | 0 | 652042 | 0 |
| Mode M9 | |||
|---|---|---|---|
| Quadrant | BADHDUFLAG | Total packets | Discarded packets |
| A | 0 | 792 | 0 |
| B | 0 | 794 | 0 |
| C | 0 | 794 | 0 |
| D | 0 | 794 | 0 |
| Mode SS | |||
|---|---|---|---|
| Quadrant | BADHDUFLAG | Total packets | Discarded packets |
| A | 0 | 4366 | 0 |
| B | 0 | 4366 | 0 |
| C | 0 | 4366 | 0 |
| D | 0 | 4366 | 0 |
| Quadrant | Total seconds | Saturated seconds | Saturation percentage |
|---|---|---|---|
| A | 213467 | 2185 | 1.023577% |
| B | 213480 | 6841 | 3.204516% |
| C | 213473 | 3313 | 1.551953% |
| D | 213463 | 18480 | 8.657238% |
Noise dominated data is calculated using 1-second bins in cleaned event files. If a bin has >2000 counts, and if more than 50% of those come from <1% of pixels, then it is considered to be noise-dominated and hence unusable.
| Quadrant | # 1 sec bins | Bins with >0 counts | Bins with >2000 counts | High rate bins dominated by noise | Noise dominated (total time) | Noise dominated (detector-on time) | Marked lightcurve |
|---|---|---|---|---|---|---|---|
| A | 296121 | 213427 | 0 | 0 | 0.00% | 0.00% | 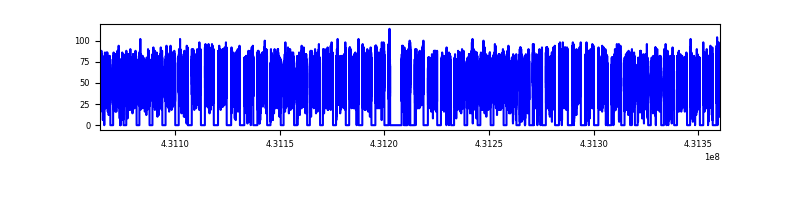 |
| B | 296121 | 213378 | 0 | 0 | 0.00% | 0.00% |  |
| C | 296121 | 213429 | 0 | 0 | 0.00% | 0.00% | 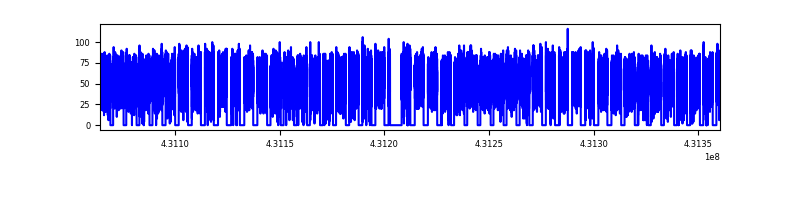 |
| D | 296121 | 212666 | 0 | 0 | 0.00% | 0.00% | 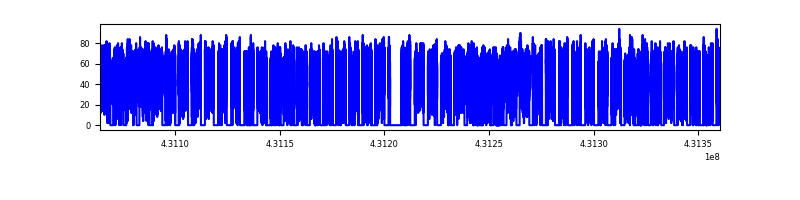 |
Top three noisy pixels from each quadrant. If the there are fewer than three noisy pixels in the level2.evt file, extra rows are filled as -1
| Pixel properties | Quadrant properties | ||||||
|---|---|---|---|---|---|---|---|
| Quadrant | DetID | PixID | Counts | Sigma | Mean | Median | Sigma |
| A | 7 | 110 | 9321 | 9.17 | 2892 | 2702 | 721.5 |
| A | 0 | 29 | 9316 | 9.17 | 2892 | 2702 | 721.5 |
| A | 9 | 19 | 9161 | 8.95 | 2892 | 2702 | 721.5 |
| B | 2 | 9 | 9064 | 11.9 | 2791 | 2657 | 538.4 |
| B | 3 | 80 | 7698 | 9.36 | 2791 | 2657 | 538.4 |
| B | 2 | 8 | 7305 | 8.63 | 2791 | 2657 | 538.4 |
| C | 1 | 81 | 9199 | 8.81 | 2895 | 2707 | 737.1 |
| C | 1 | 80 | 8788 | 8.25 | 2895 | 2707 | 737.1 |
| C | 3 | 202 | 8753 | 8.2 | 2895 | 2707 | 737.1 |
| D | 10 | 189 | 6912 | 6.59 | 2590 | 2353 | 691.6 |
| D | 11 | 66 | 6711 | 6.3 | 2590 | 2353 | 691.6 |
| D | 7 | 3 | 6709 | 6.3 | 2590 | 2353 | 691.6 |
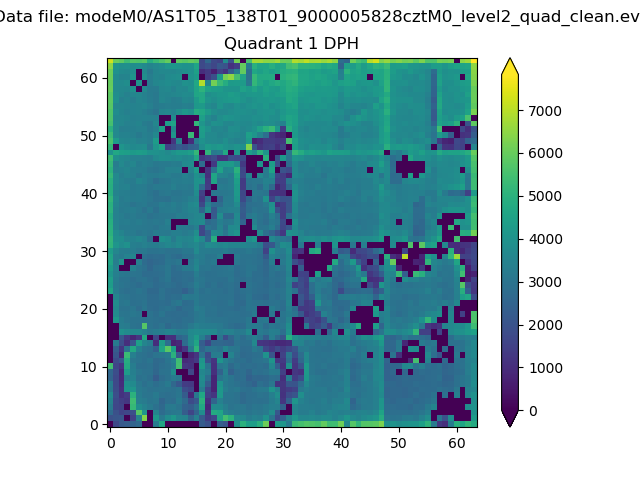
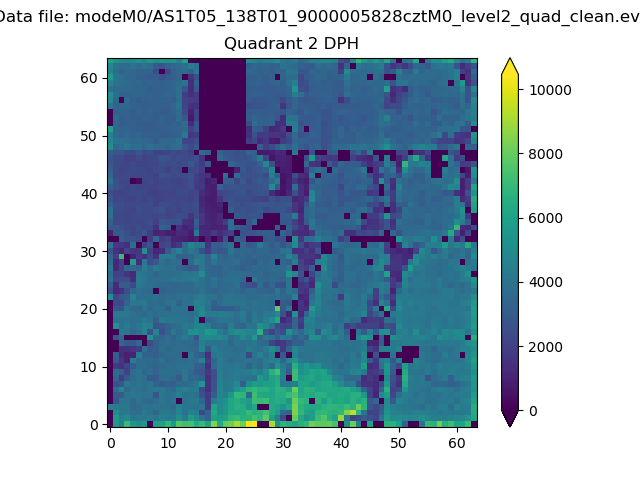
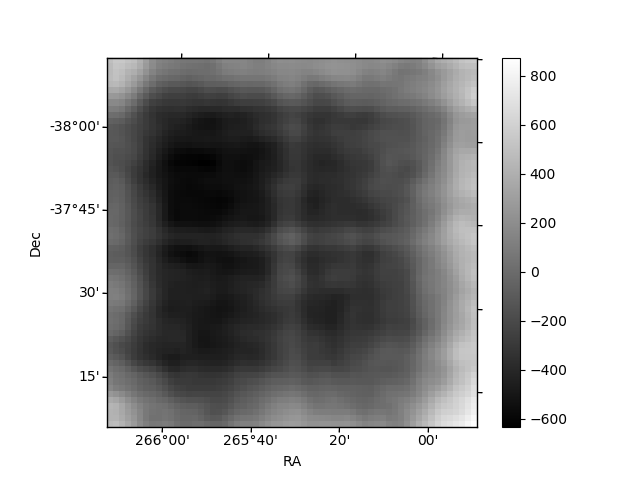
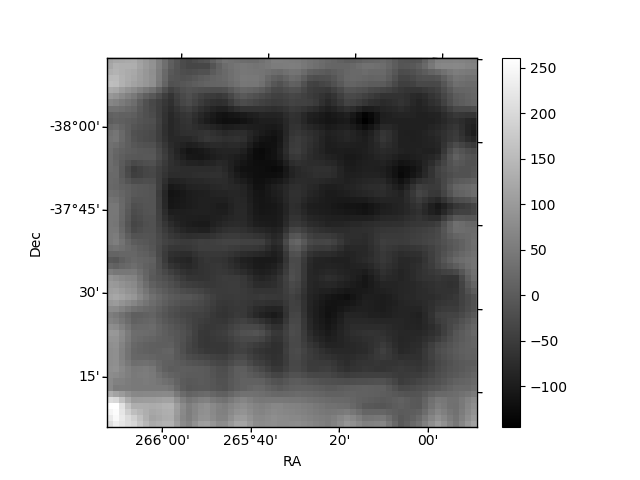
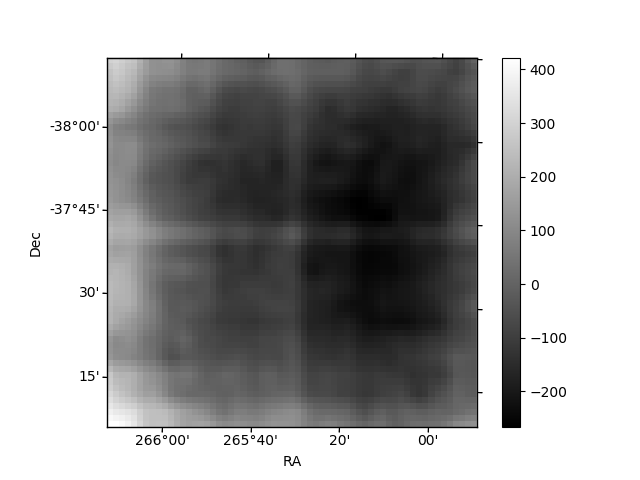
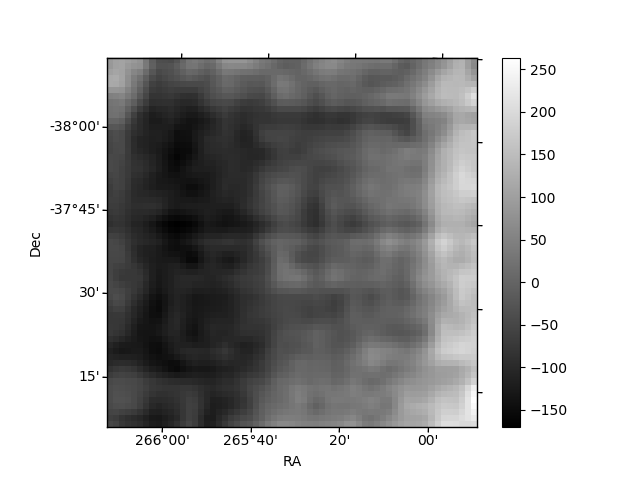
Histogram calculated using DETX and DETY for each event in the final _common_clean file
| Quadrant A | 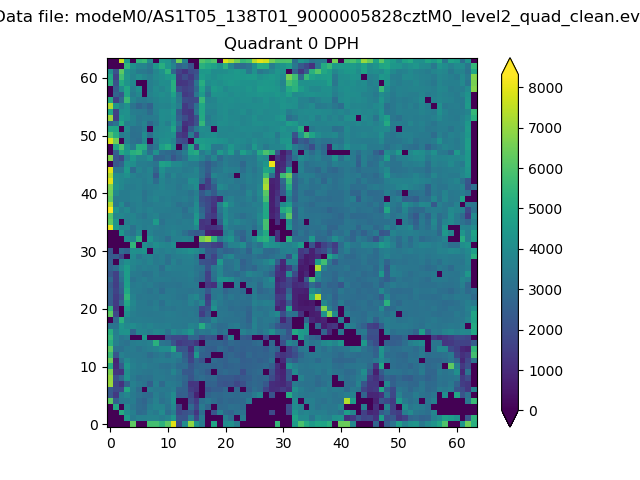 |
 |
Quadrant B |
|---|---|---|---|
| Quadrant D | 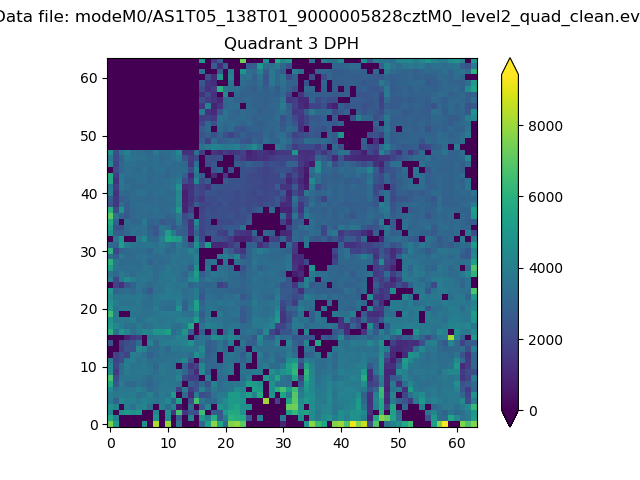 |
 |
Quadrant C |
| Plot type | Count rate plots | Images |
|---|---|---|
| Comparison with Poisson distribution Blue bars denote a histogram of data divided into 1 sec bins. Red curve is a Poisson curve with rate = median count rate of data. |
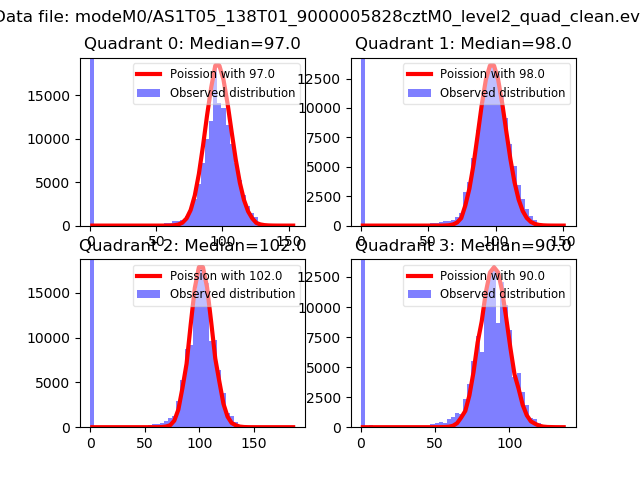 |
 |
| Quadrant-wise count rates Data is divided into 100 sec bins |
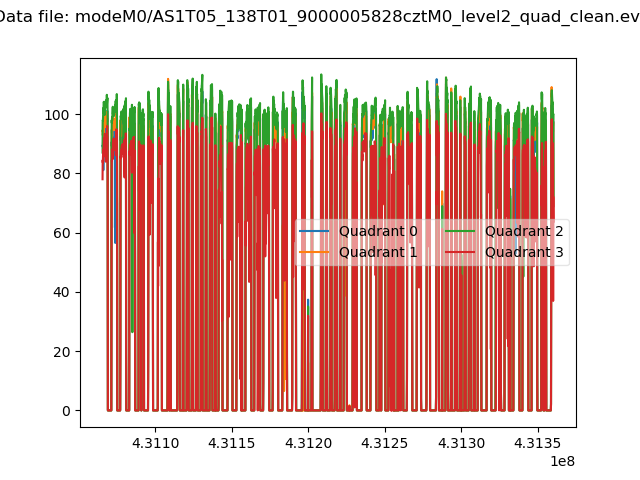 |
|
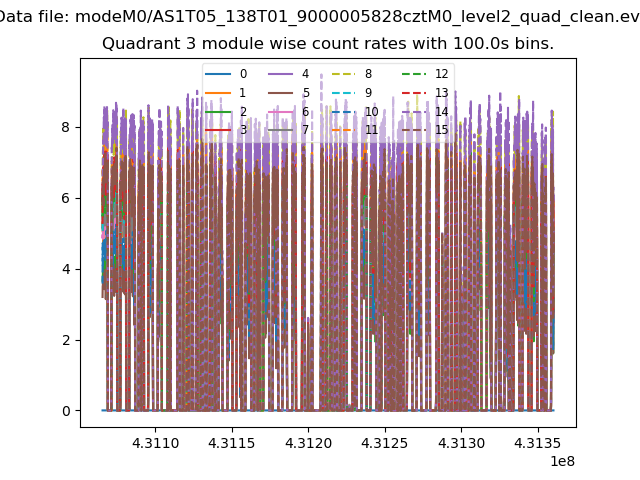
| Module-wise count rates for Quadrant A Data is divided into 100 sec bins |
 |
 |
| Module-wise count rates for Quadrant B Data is divided into 100 sec bins |
 |
 |
| Module-wise count rates for Quadrant C Data is divided into 100 sec bins |
 |
 |
| Module-wise count rates for Quadrant D Data is divided into 100 sec bins |
 |
 |
| Parameter | Plot |
|---|---|
| CZT HV Monitor |  |
| D_VDD | 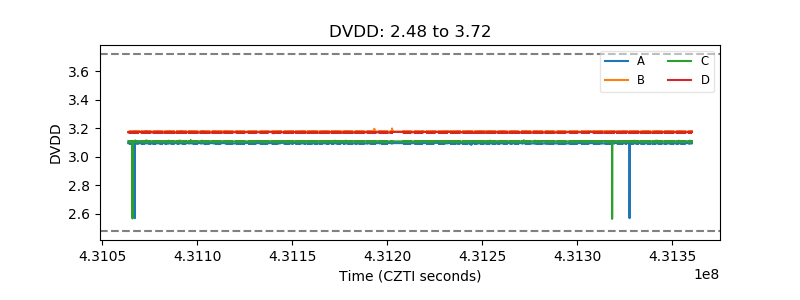 |
| Temperature 1 |  |
| Veto HV Monitor |  |
| Veto LLD | 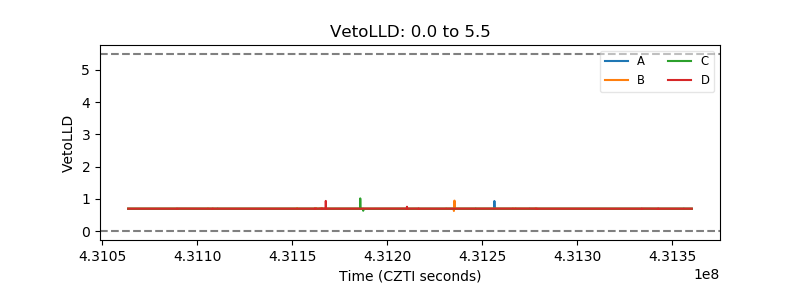 |
| Alpha Counter | 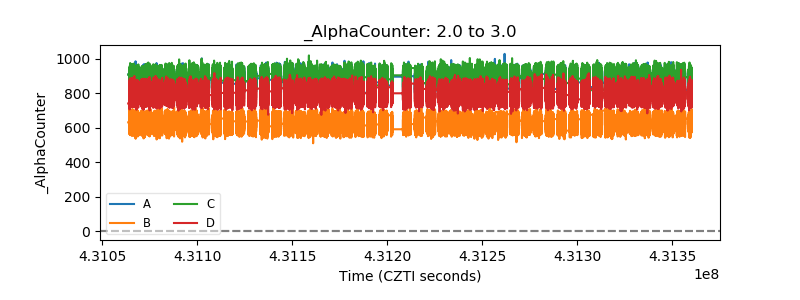 |
| _CPM_Rate | 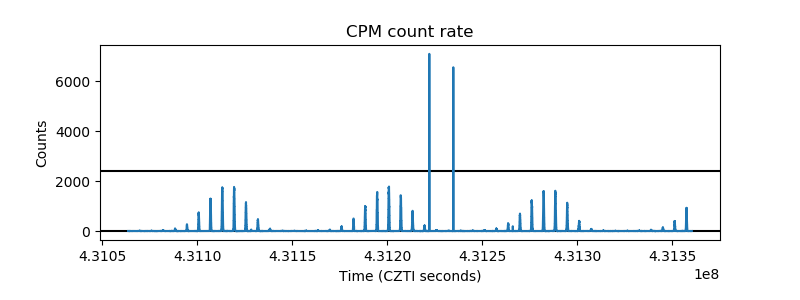 |
| CZT Counter | 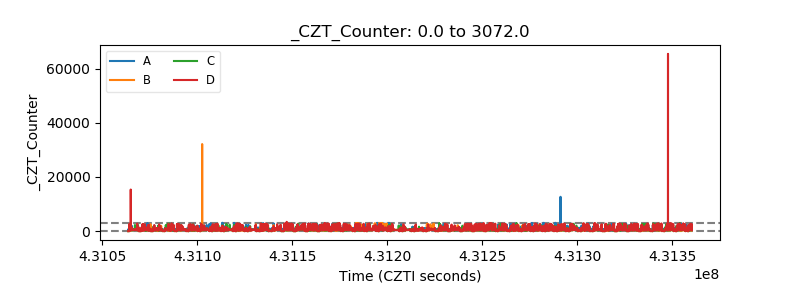 |
| +2.5 Volts monitor |  |
| +5 Volts monitor |  |
| _ROLL_ROT | 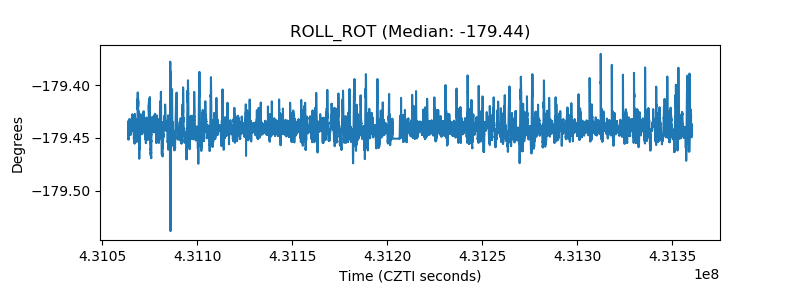 |
| _Roll_DEC | 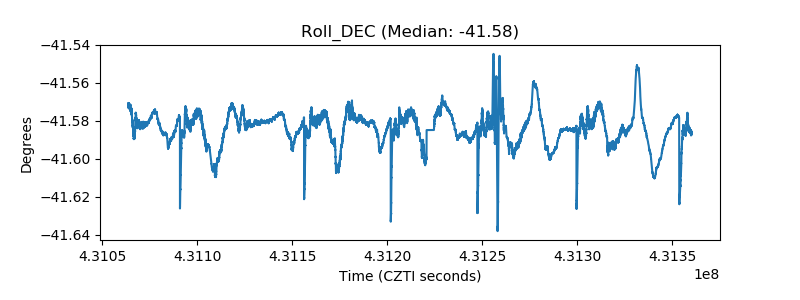 |
| _Roll_RA | 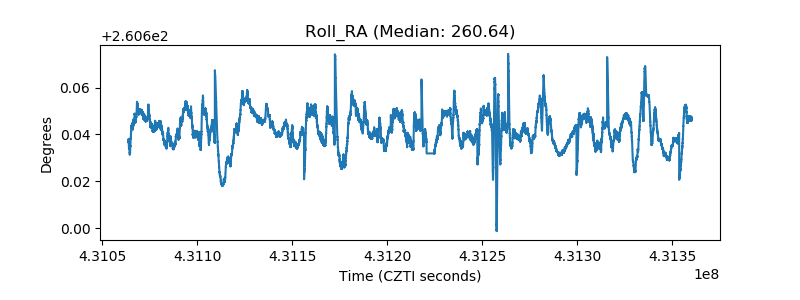 |
| Veto Counter | 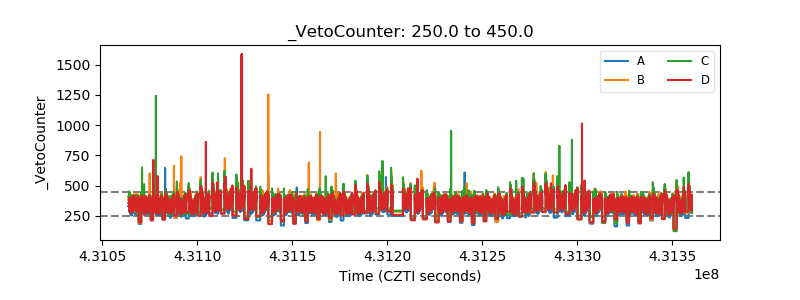 |