| Param | Original file | Final file |
|---|---|---|
| Filename | modeM0/AS1T05_143T01_9000005830cztM0_level2.fits | modeM0/AS1T05_143T01_9000005830cztM0_level2_quad_clean.evt |
| Size (bytes) | 2,253,712,320 | 2,754,976,320 |
| Size | 2.1 GB | 2.6 GB |
| Events in quadrant A | 13,531,788 | 17,847,044 |
| Events in quadrant B | 12,358,144 | 16,326,638 |
| Events in quadrant C | 13,233,452 | 16,600,493 |
| Events in quadrant D | 11,265,978 | 14,825,802 |
| Mode M0 | |||
|---|---|---|---|
| Quadrant | BADHDUFLAG | Total packets | Discarded packets |
| A | 0 | 618623 | 0 |
| B | 0 | 696066 | 0 |
| C | 0 | 614587 | 0 |
| D | 0 | 761032 | 0 |
| Mode M9 | |||
|---|---|---|---|
| Quadrant | BADHDUFLAG | Total packets | Discarded packets |
| A | 0 | 1010 | 0 |
| B | 0 | 1010 | 0 |
| C | 0 | 1010 | 0 |
| D | 0 | 1010 | 0 |
| Mode SS | |||
|---|---|---|---|
| Quadrant | BADHDUFLAG | Total packets | Discarded packets |
| A | 0 | 5324 | 0 |
| B | 0 | 5324 | 0 |
| C | 0 | 5324 | 0 |
| D | 0 | 5324 | 0 |
| Quadrant | Total seconds | Saturated seconds | Saturation percentage |
|---|---|---|---|
| A | 260503 | 5534 | 2.124352% |
| B | 260503 | 24808 | 9.523115% |
| C | 260503 | 6126 | 2.351604% |
| D | 260503 | 17180 | 6.594934% |
Noise dominated data is calculated using 1-second bins in cleaned event files. If a bin has >2000 counts, and if more than 50% of those come from <1% of pixels, then it is considered to be noise-dominated and hence unusable.
| Quadrant | # 1 sec bins | Bins with >0 counts | Bins with >2000 counts | High rate bins dominated by noise | Noise dominated (total time) | Noise dominated (detector-on time) | Marked lightcurve |
|---|---|---|---|---|---|---|---|
| A | 361388 | 260134 | 0 | 0 | 0.00% | 0.00% | 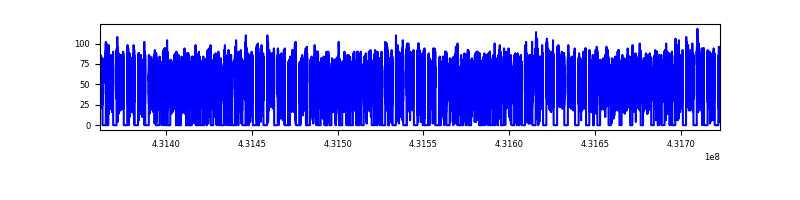 |
| B | 361388 | 259980 | 0 | 0 | 0.00% | 0.00% | 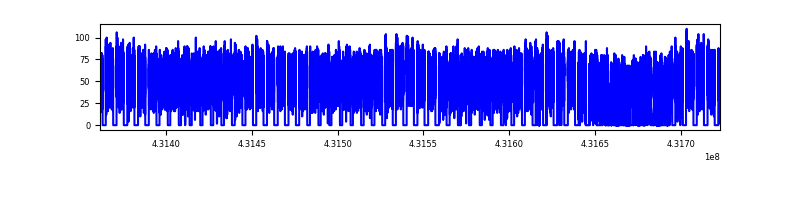 |
| C | 361388 | 260140 | 0 | 0 | 0.00% | 0.00% | 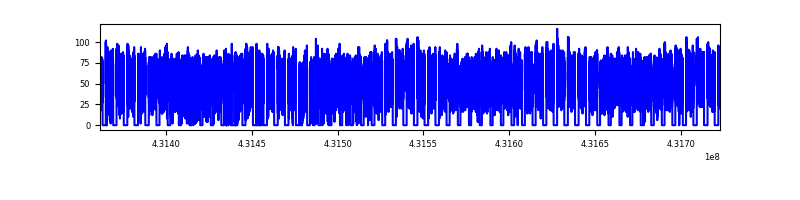 |
| D | 361388 | 259988 | 0 | 0 | 0.00% | 0.00% | 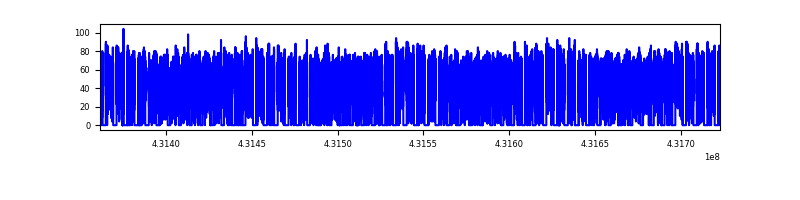 |
Top three noisy pixels from each quadrant. If the there are fewer than three noisy pixels in the level2.evt file, extra rows are filled as -1
| Pixel properties | Quadrant properties | ||||||
|---|---|---|---|---|---|---|---|
| Quadrant | DetID | PixID | Counts | Sigma | Mean | Median | Sigma |
| A | 0 | 29 | 11418 | 9.09 | 3535 | 3311 | 891.8 |
| A | 9 | 19 | 11400 | 9.07 | 3535 | 3311 | 891.8 |
| A | 7 | 110 | 11360 | 9.03 | 3535 | 3311 | 891.8 |
| B | 2 | 9 | 10720 | 12.3 | 3268 | 3124 | 617.8 |
| B | 3 | 80 | 9004 | 9.52 | 3268 | 3124 | 617.8 |
| B | 3 | 17 | 8643 | 8.93 | 3268 | 3124 | 617.8 |
| C | 1 | 81 | 11106 | 8.8 | 3501 | 3280 | 889.0 |
| C | 1 | 80 | 10625 | 8.26 | 3501 | 3280 | 889.0 |
| C | 3 | 202 | 10606 | 8.24 | 3501 | 3280 | 889.0 |
| D | 10 | 189 | 8320 | 6.25 | 3226 | 2937 | 861.3 |
| D | 7 | 3 | 8278 | 6.2 | 3226 | 2937 | 861.3 |
| D | 4 | 160 | 8276 | 6.2 | 3226 | 2937 | 861.3 |
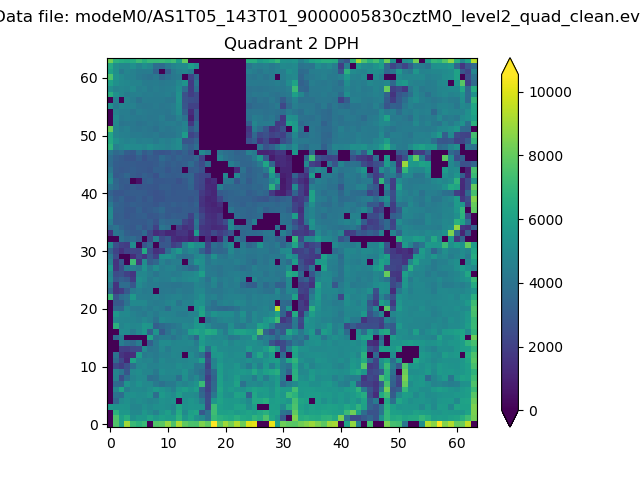
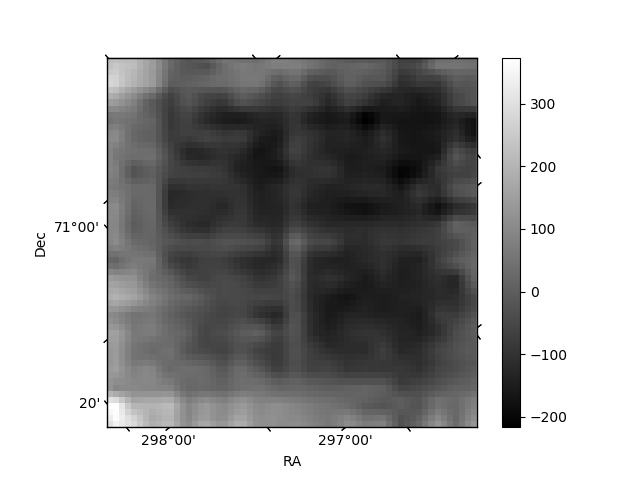
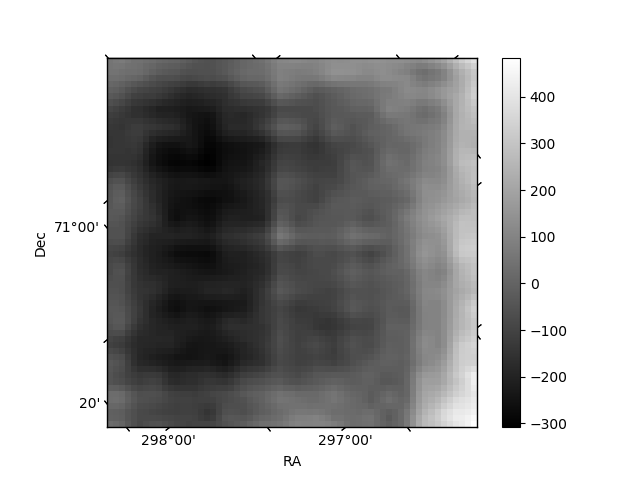
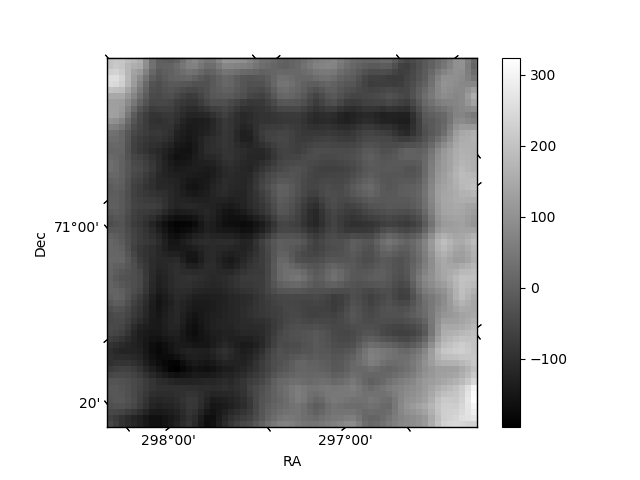
Histogram calculated using DETX and DETY for each event in the final _common_clean file
| Quadrant A | 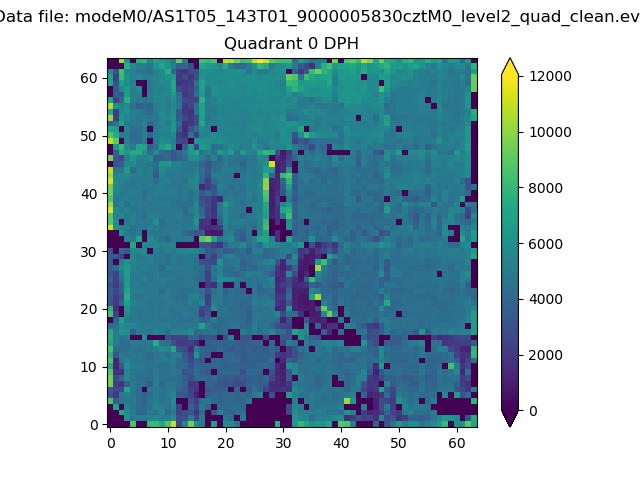 |
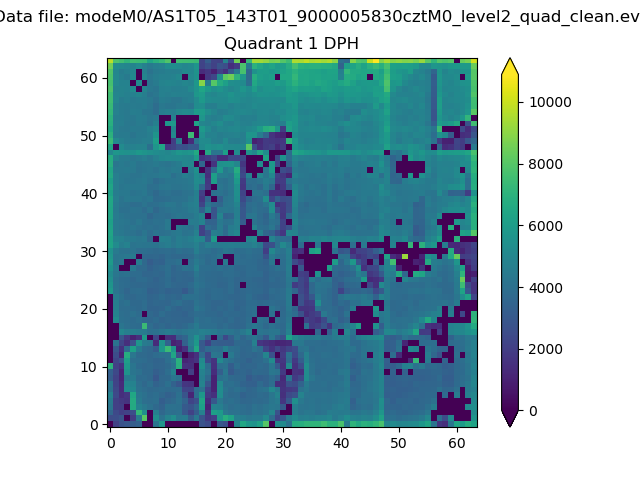 |
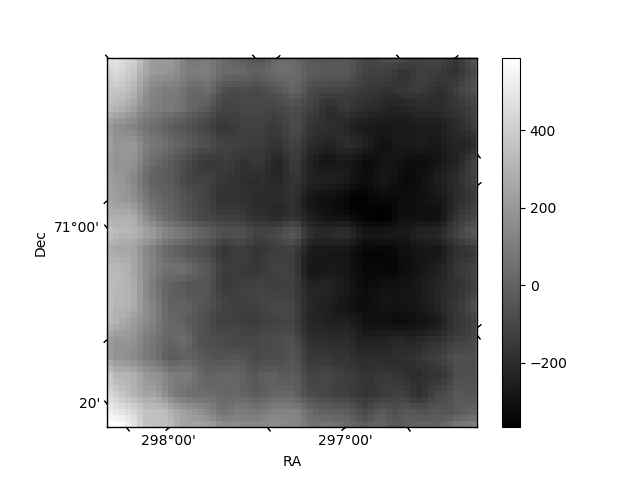
Quadrant B |
|---|---|---|---|
| Quadrant D | 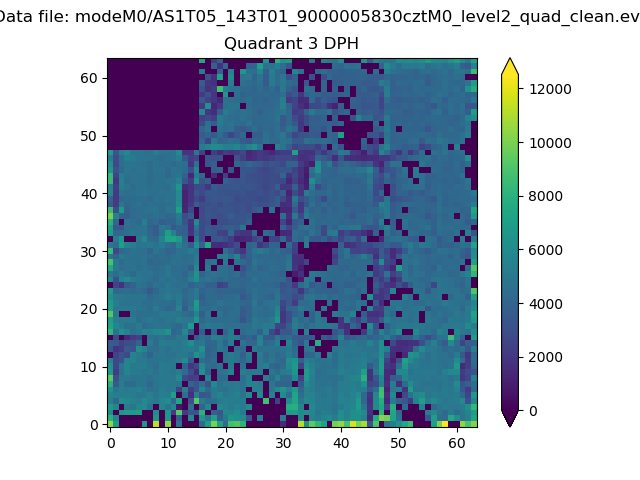 |
 |
Quadrant C |
| Plot type | Count rate plots | Images |
|---|---|---|
| Comparison with Poisson distribution Blue bars denote a histogram of data divided into 1 sec bins. Red curve is a Poisson curve with rate = median count rate of data. |
 |
 |
| Quadrant-wise count rates Data is divided into 100 sec bins |
 |
|
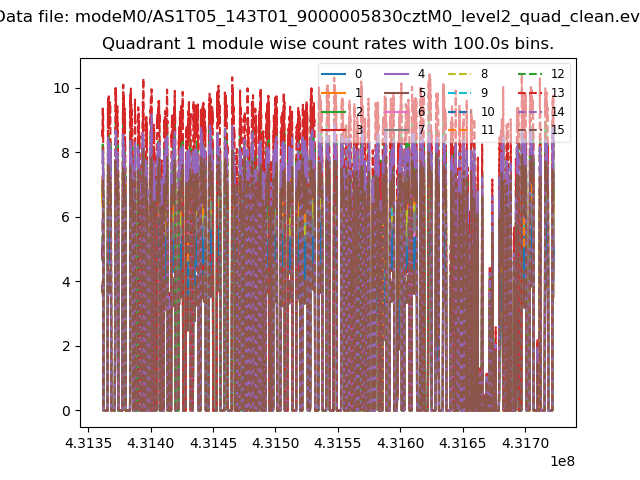
| Module-wise count rates for Quadrant A Data is divided into 100 sec bins |
 |
 |
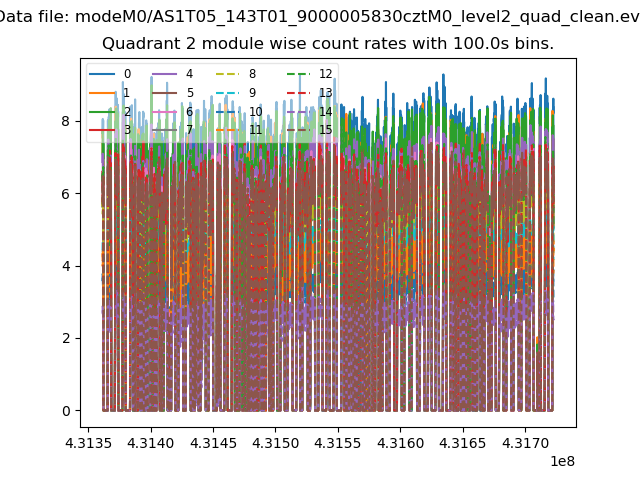
| Module-wise count rates for Quadrant B Data is divided into 100 sec bins |
 |
 |
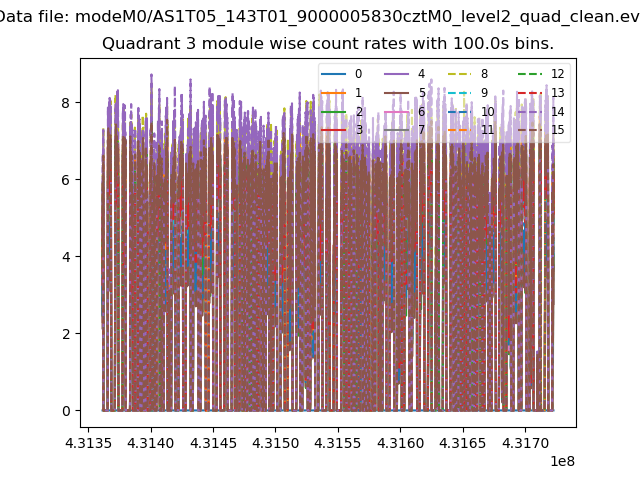
| Module-wise count rates for Quadrant C Data is divided into 100 sec bins |
 |
 |
| Module-wise count rates for Quadrant D Data is divided into 100 sec bins |
 |
 |
| Parameter | Plot |
|---|---|
| CZT HV Monitor |  |
| D_VDD | 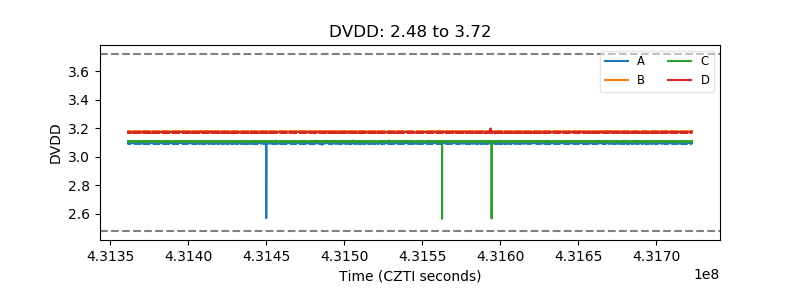 |
| Temperature 1 | 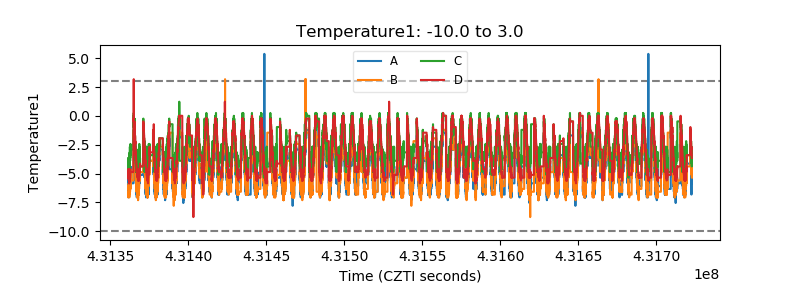 |
| Veto HV Monitor | 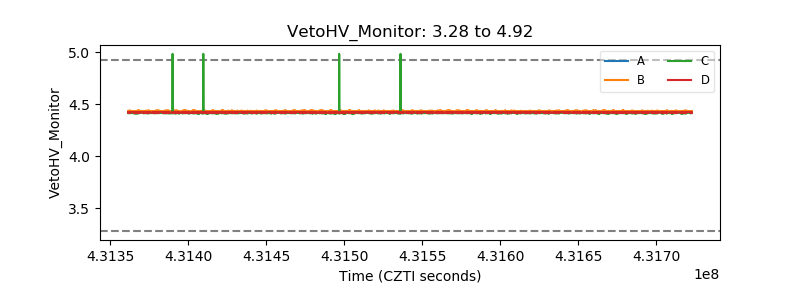 |
| Veto LLD | 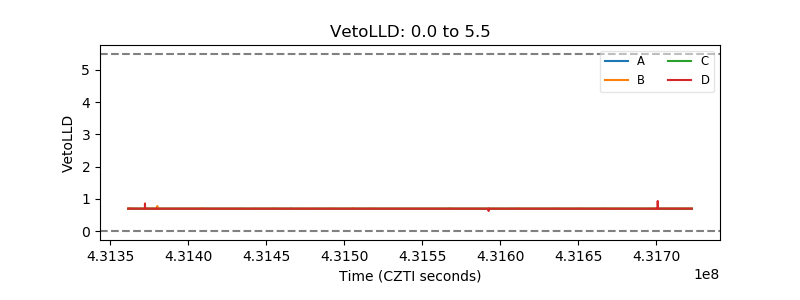 |
| Alpha Counter | 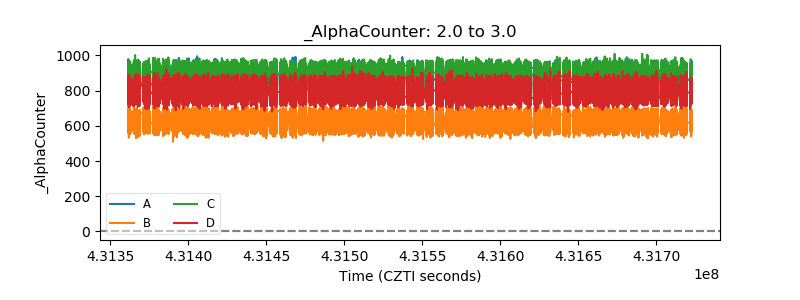 |
| _CPM_Rate | 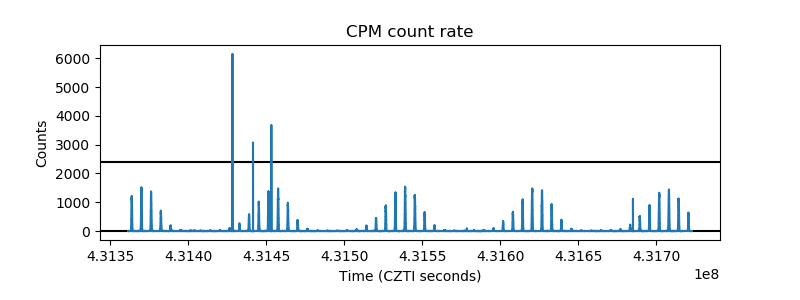 |
| CZT Counter | 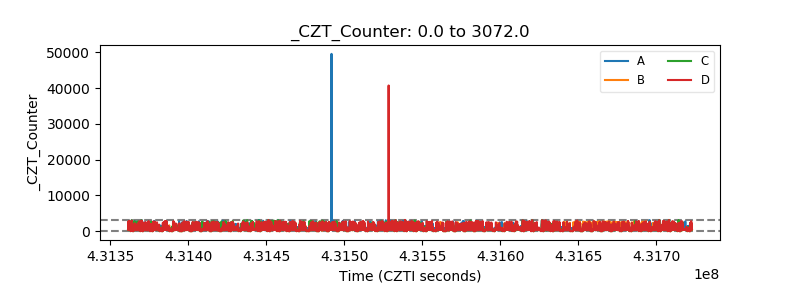 |
| +2.5 Volts monitor | 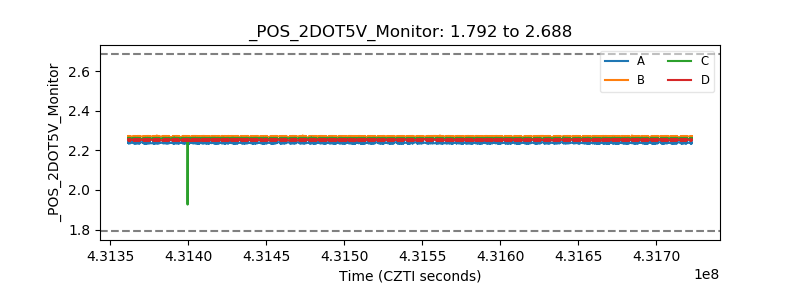 |
| +5 Volts monitor |  |
| _ROLL_ROT | 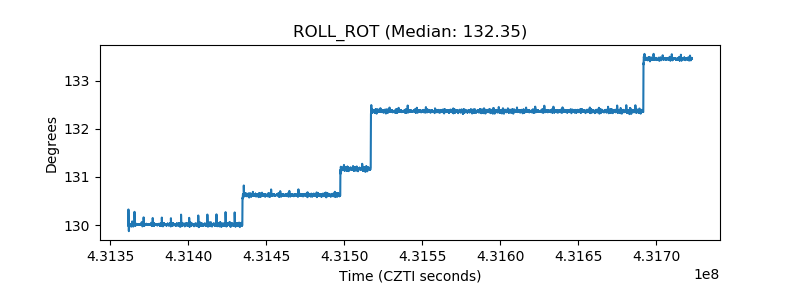 |
| _Roll_DEC | 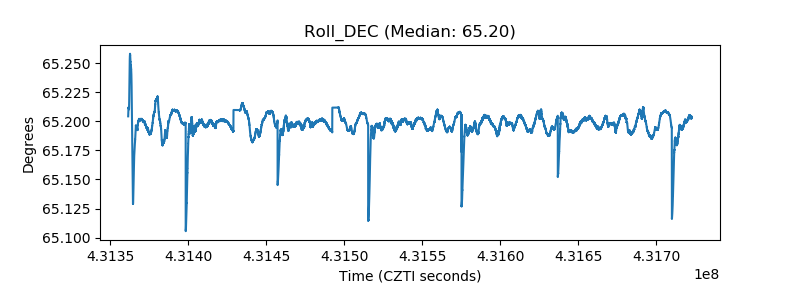 |
| _Roll_RA | 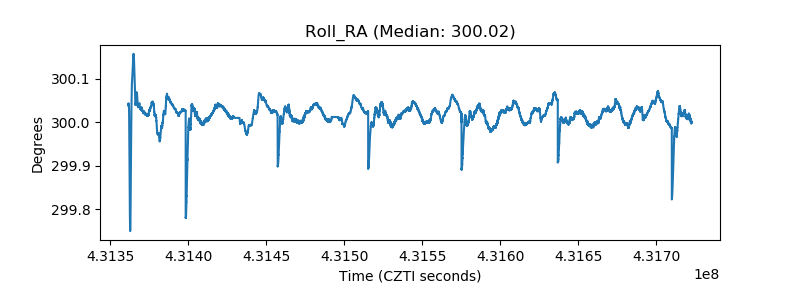 |
| Veto Counter | 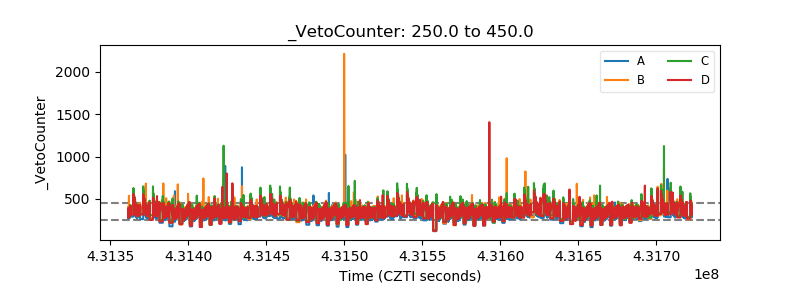 |