| Param | Original file | Final file |
|---|---|---|
| Filename | modeM0/AS1A09_036T05_9000005832cztM0_level2.fits | modeM0/AS1A09_036T05_9000005832cztM0_level2_quad_clean.evt |
| Size (bytes) | 89,308,800 | 108,835,200 |
| Size | 85.2 MB | 103.8 MB |
| Events in quadrant A | 426,816 | 574,515 |
| Events in quadrant B | 515,094 | 668,990 |
| Events in quadrant C | 544,024 | 681,891 |
| Events in quadrant D | 462,854 | 615,924 |
| Mode M0 | |||
|---|---|---|---|
| Quadrant | BADHDUFLAG | Total packets | Discarded packets |
| A | 0 | 39849 | 0 |
| B | 0 | 29487 | 0 |
| C | 0 | 22006 | 0 |
| D | 0 | 29031 | 0 |
| Mode M9 | |||
|---|---|---|---|
| Quadrant | BADHDUFLAG | Total packets | Discarded packets |
| A | 0 | 45 | 0 |
| B | 0 | 46 | 0 |
| C | 0 | 46 | 0 |
| D | 0 | 46 | 0 |
| Mode SS | |||
|---|---|---|---|
| Quadrant | BADHDUFLAG | Total packets | Discarded packets |
| A | 0 | 220 | 0 |
| B | 0 | 220 | 0 |
| C | 0 | 220 | 0 |
| D | 0 | 220 | 0 |
| Quadrant | Total seconds | Saturated seconds | Saturation percentage |
|---|---|---|---|
| A | 10899 | 2832 | 25.984035% |
| B | 10899 | 800 | 7.340123% |
| C | 10899 | 8 | 0.073401% |
| D | 10899 | 515 | 4.725204% |
Noise dominated data is calculated using 1-second bins in cleaned event files. If a bin has >2000 counts, and if more than 50% of those come from <1% of pixels, then it is considered to be noise-dominated and hence unusable.
| Quadrant | # 1 sec bins | Bins with >0 counts | Bins with >2000 counts | High rate bins dominated by noise | Noise dominated (total time) | Noise dominated (detector-on time) | Marked lightcurve |
|---|---|---|---|---|---|---|---|
| A | 14183 | 9351 | 0 | 0 | 0.00% | 0.00% |  |
| B | 14183 | 10895 | 0 | 0 | 0.00% | 0.00% |  |
| C | 14183 | 10897 | 0 | 0 | 0.00% | 0.00% |  |
| D | 14183 | 10886 | 0 | 0 | 0.00% | 0.00% |  |
Top three noisy pixels from each quadrant. If the there are fewer than three noisy pixels in the level2.evt file, extra rows are filled as -1
| Pixel properties | Quadrant properties | ||||||
|---|---|---|---|---|---|---|---|
| Quadrant | DetID | PixID | Counts | Sigma | Mean | Median | Sigma |
| A | 0 | 29 | 375 | 8.89 | 111 | 105 | 30.4 |
| A | 0 | 30 | 349 | 8.03 | 111 | 105 | 30.4 |
| A | 9 | 19 | 329 | 7.37 | 111 | 105 | 30.4 |
| B | 2 | 9 | 444 | 10.89 | 136 | 130 | 28.8 |
| B | 3 | 80 | 380 | 8.67 | 136 | 130 | 28.8 |
| B | 2 | 8 | 371 | 8.36 | 136 | 130 | 28.8 |
| C | 1 | 81 | 468 | 8.56 | 143 | 134 | 39.0 |
| C | 1 | 80 | 437 | 7.77 | 143 | 134 | 39.0 |
| C | 3 | 203 | 435 | 7.71 | 143 | 134 | 39.0 |
| D | 6 | 67 | 360 | 6.47 | 132 | 120 | 37.1 |
| D | 3 | 14 | 340 | 5.93 | 132 | 120 | 37.1 |
| D | 7 | 3 | 339 | 5.9 | 132 | 120 | 37.1 |
Histogram calculated using DETX and DETY for each event in the final _common_clean file
| Quadrant A |  |
 |
Quadrant B |
|---|---|---|---|
| Quadrant D | 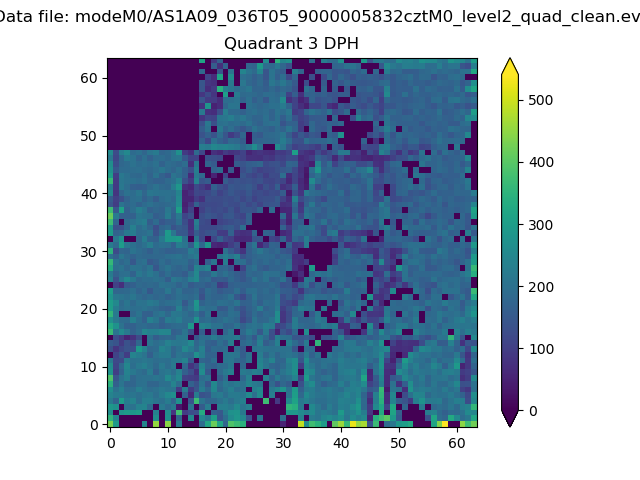 |
 |
Quadrant C |
| Plot type | Count rate plots | Images |
|---|---|---|
| Comparison with Poisson distribution Blue bars denote a histogram of data divided into 1 sec bins. Red curve is a Poisson curve with rate = median count rate of data. |
 |
 |
| Quadrant-wise count rates Data is divided into 100 sec bins |
 |
|
| Module-wise count rates for Quadrant A Data is divided into 100 sec bins |
 |
 |
| Module-wise count rates for Quadrant B Data is divided into 100 sec bins |
 |
 |
| Module-wise count rates for Quadrant C Data is divided into 100 sec bins |
 |
 |
| Module-wise count rates for Quadrant D Data is divided into 100 sec bins |
 |
 |
| Parameter | Plot |
|---|---|
| CZT HV Monitor |  |
| D_VDD |  |
| Temperature 1 |  |
| Veto HV Monitor | 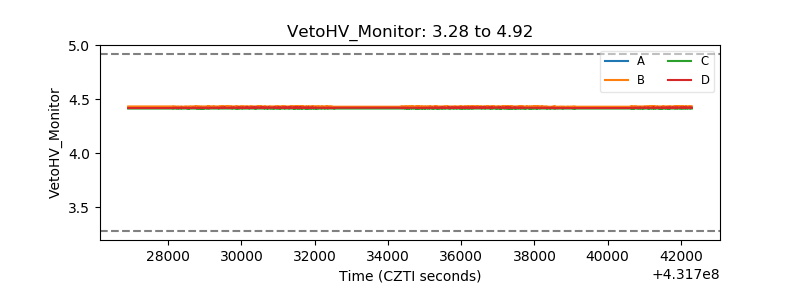 |
| Veto LLD |  |
| Alpha Counter |  |
| _CPM_Rate |  |
| CZT Counter |  |
| +2.5 Volts monitor |  |
| +5 Volts monitor |  |
| _ROLL_ROT |  |
| _Roll_DEC |  |
| _Roll_RA |  |
| Veto Counter |  |