| Param | Original file | Final file |
|---|---|---|
| Filename | modeM0/AS1T05_145T01_9000005836cztM0_level2.fits | modeM0/AS1T05_145T01_9000005836cztM0_level2_quad_clean.evt |
| Size (bytes) | 471,830,400 | 645,301,440 |
| Size | 450.0 MB | 615.4 MB |
| Events in quadrant A | 3,252,318 | 5,273,557 |
| Events in quadrant B | 1,014,792 | 890,212 |
| Events in quadrant C | 3,250,282 | 5,128,847 |
| Events in quadrant D | 2,701,946 | 4,206,994 |
| Mode M0 | |||
|---|---|---|---|
| Quadrant | BADHDUFLAG | Total packets | Discarded packets |
| A | 0 | 158444 | 0 |
| B | 0 | 401768 | 0 |
| C | 0 | 124480 | 0 |
| D | 0 | 180732 | 0 |
| Mode M9 | |||
|---|---|---|---|
| Quadrant | BADHDUFLAG | Total packets | Discarded packets |
| A | 0 | 229 | 0 |
| B | 0 | 229 | 0 |
| C | 0 | 229 | 0 |
| D | 0 | 229 | 0 |
| Mode SS | |||
|---|---|---|---|
| Quadrant | BADHDUFLAG | Total packets | Discarded packets |
| A | 0 | 1208 | 0 |
| B | 0 | 1208 | 0 |
| C | 0 | 1208 | 0 |
| D | 0 | 1208 | 0 |
| Quadrant | Total seconds | Saturated seconds | Saturation percentage |
|---|---|---|---|
| A | 58963 | 1938 | 3.286807% |
| B | 58955 | 46910 | 79.569163% |
| C | 58970 | 89 | 0.150924% |
| D | 58957 | 3943 | 6.687925% |
Noise dominated data is calculated using 1-second bins in cleaned event files. If a bin has >2000 counts, and if more than 50% of those come from <1% of pixels, then it is considered to be noise-dominated and hence unusable.
| Quadrant | # 1 sec bins | Bins with >0 counts | Bins with >2000 counts | High rate bins dominated by noise | Noise dominated (total time) | Noise dominated (detector-on time) | Marked lightcurve |
|---|---|---|---|---|---|---|---|
| A | 81494 | 58913 | 0 | 0 | 0.00% | 0.00% |  |
| B | 81494 | 52352 | 0 | 0 | 0.00% | 0.00% |  |
| C | 81493 | 58964 | 0 | 0 | 0.00% | 0.00% |  |
| D | 81494 | 58906 | 0 | 0 | 0.00% | 0.00% |  |
Top three noisy pixels from each quadrant. If the there are fewer than three noisy pixels in the level2.evt file, extra rows are filled as -1
| Pixel properties | Quadrant properties | ||||||
|---|---|---|---|---|---|---|---|
| Quadrant | DetID | PixID | Counts | Sigma | Mean | Median | Sigma |
| A | 14 | 188 | 3977 | 14.9 | 845 | 793 | 213.6 |
| A | 14 | 204 | 3097 | 10.78 | 845 | 793 | 213.6 |
| A | 7 | 110 | 2943 | 10.06 | 845 | 793 | 213.6 |
| B | 2 | 9 | 890 | 11.21 | 267 | 256 | 56.6 |
| B | 2 | 8 | 716 | 8.13 | 267 | 256 | 56.6 |
| B | 5 | 128 | 709 | 8.01 | 267 | 256 | 56.6 |
| C | 1 | 81 | 3172 | 10.6 | 857 | 804 | 223.5 |
| C | 1 | 80 | 2973 | 9.71 | 857 | 804 | 223.5 |
| C | 3 | 203 | 2710 | 8.53 | 857 | 804 | 223.5 |
| D | 6 | 38 | 2019 | 6.35 | 772 | 704 | 207.0 |
| D | 7 | 3 | 2015 | 6.33 | 772 | 704 | 207.0 |
| D | 4 | 160 | 1995 | 6.23 | 772 | 704 | 207.0 |
Histogram calculated using DETX and DETY for each event in the final _common_clean file
| Quadrant A | 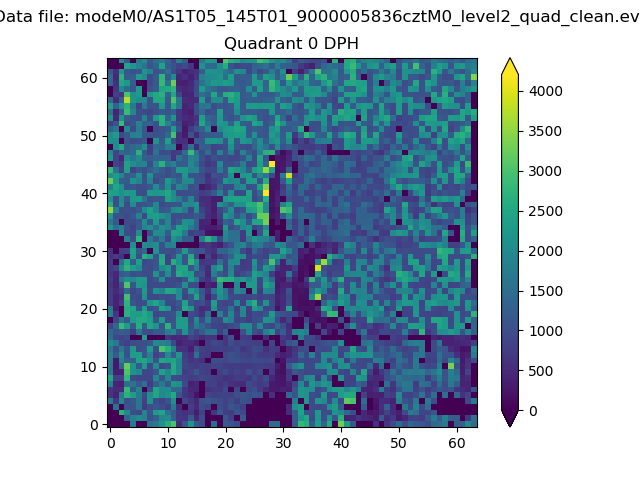 |
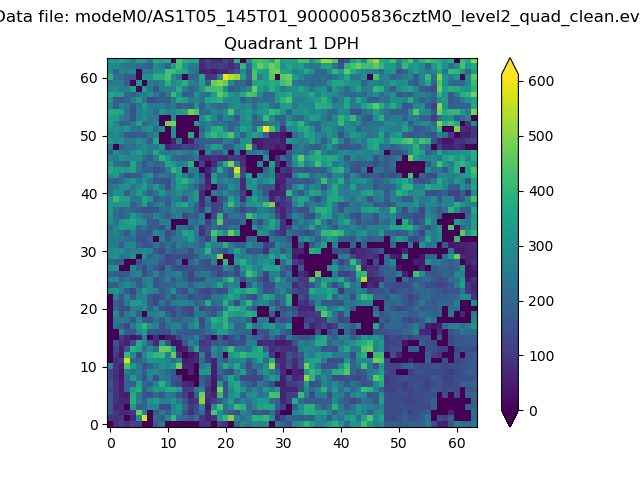 |
Quadrant B |
|---|---|---|---|
| Quadrant D |  |
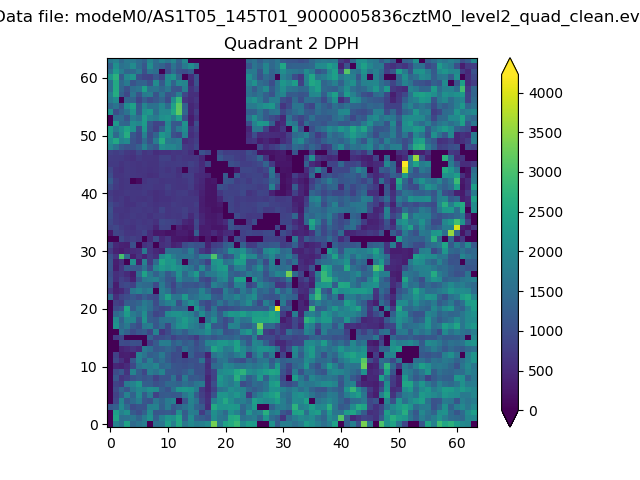 |
Quadrant C |
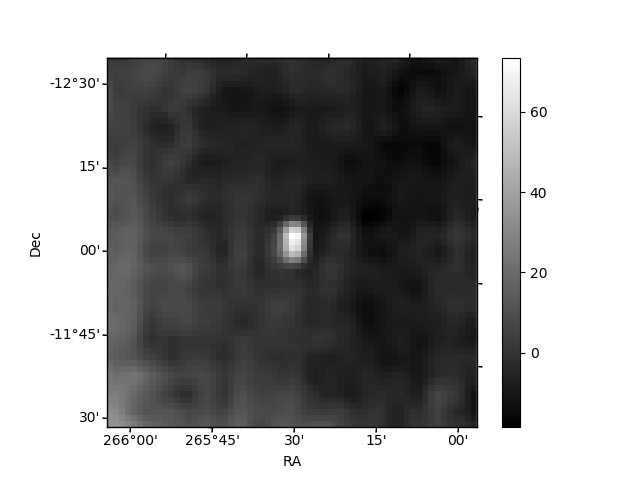
| Plot type | Count rate plots | Images |
|---|---|---|
| Comparison with Poisson distribution Blue bars denote a histogram of data divided into 1 sec bins. Red curve is a Poisson curve with rate = median count rate of data. |
 |
 |
| Quadrant-wise count rates Data is divided into 100 sec bins |
 |
|
| Module-wise count rates for Quadrant A Data is divided into 100 sec bins |
 |
 |
| Module-wise count rates for Quadrant B Data is divided into 100 sec bins |
 |
 |
| Module-wise count rates for Quadrant C Data is divided into 100 sec bins |
 |
 |
| Module-wise count rates for Quadrant D Data is divided into 100 sec bins |
 |
 |
| Parameter | Plot |
|---|---|
| CZT HV Monitor |  |
| D_VDD | 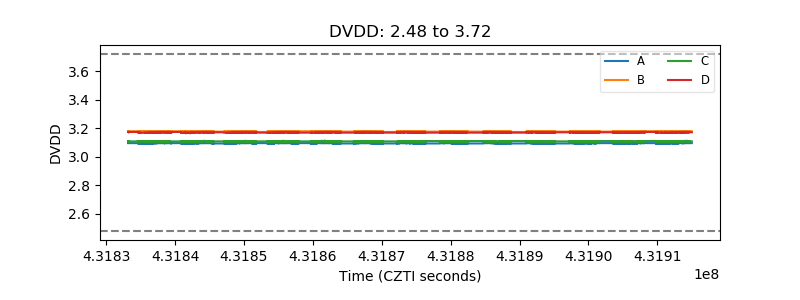 |
| Temperature 1 |  |
| Veto HV Monitor |  |
| Veto LLD |  |
| Alpha Counter |  |
| _CPM_Rate |  |
| CZT Counter |  |
| +2.5 Volts monitor |  |
| +5 Volts monitor |  |
| _ROLL_ROT |  |
| _Roll_DEC |  |
| _Roll_RA | 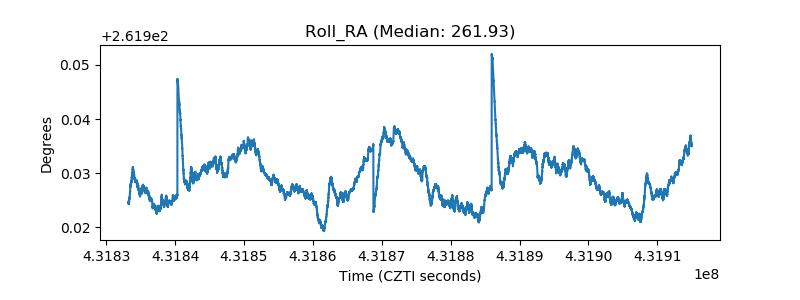 |
| Veto Counter |  |