| Param | Original file | Final file |
|---|---|---|
| Filename | modeM0/AS1T05_148T01_9000005838cztM0_level2.fits | modeM0/AS1T05_148T01_9000005838cztM0_level2_quad_clean.evt |
| Size (bytes) | 3,080,911,680 | 4,255,248,960 |
| Size | 2.9 GB | 4.0 GB |
| Events in quadrant A | 18,997,396 | 29,248,828 |
| Events in quadrant B | 17,013,064 | 25,284,356 |
| Events in quadrant C | 18,501,834 | 28,123,813 |
| Events in quadrant D | 15,426,978 | 22,895,942 |
| Mode M9 | |||
|---|---|---|---|
| Quadrant | BADHDUFLAG | Total packets | Discarded packets |
| A | 0 | 1268 | 0 |
| B | 0 | 1270 | 0 |
| C | 0 | 1270 | 0 |
| D | 0 | 1270 | 0 |
| Mode SS | |||
|---|---|---|---|
| Quadrant | BADHDUFLAG | Total packets | Discarded packets |
| A | 0 | 6888 | 0 |
| B | 0 | 6972 | 0 |
| C | 0 | 6972 | 0 |
| D | 0 | 6972 | 0 |
| Mode M0 | |||
|---|---|---|---|
| Quadrant | BADHDUFLAG | Total packets | Discarded packets |
| A | 0 | 840568 | 0 |
| B | 0 | 1047065 | 0 |
| C | 0 | 738126 | 0 |
| D | 0 | 1032195 | 0 |
| Quadrant | Total seconds | Saturated seconds | Saturation percentage |
|---|---|---|---|
| A | 340837 | 3917 | 1.149230% |
| B | 340837 | 38440 | 11.278118% |
| C | 340837 | 1880 | 0.551583% |
| D | 340837 | 26082 | 7.652338% |
Noise dominated data is calculated using 1-second bins in cleaned event files. If a bin has >2000 counts, and if more than 50% of those come from <1% of pixels, then it is considered to be noise-dominated and hence unusable.
| Quadrant | # 1 sec bins | Bins with >0 counts | Bins with >2000 counts | High rate bins dominated by noise | Noise dominated (total time) | Noise dominated (detector-on time) | Marked lightcurve |
|---|---|---|---|---|---|---|---|
| A | 472175 | 340673 | 0 | 0 | 0.00% | 0.00% | 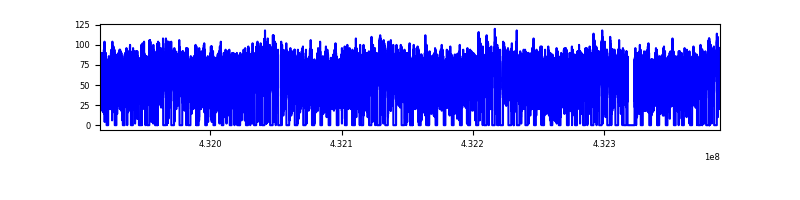 |
| B | 472176 | 340076 | 0 | 0 | 0.00% | 0.00% |  |
| C | 472175 | 340783 | 0 | 0 | 0.00% | 0.00% | 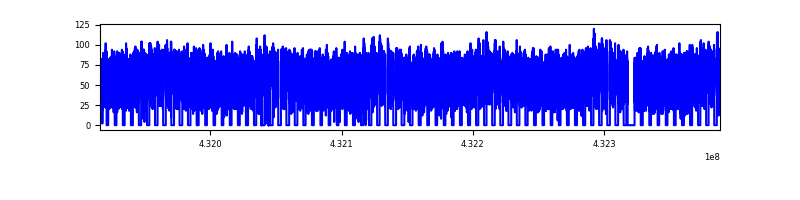 |
| D | 472175 | 340309 | 0 | 0 | 0.00% | 0.00% |  |
Top three noisy pixels from each quadrant. If the there are fewer than three noisy pixels in the level2.evt file, extra rows are filled as -1
| Pixel properties | Quadrant properties | ||||||
|---|---|---|---|---|---|---|---|
| Quadrant | DetID | PixID | Counts | Sigma | Mean | Median | Sigma |
| A | 14 | 188 | 23262 | 15.31 | 4938 | 4644 | 1216.0 |
| A | 14 | 204 | 18282 | 11.22 | 4938 | 4644 | 1216.0 |
| A | 7 | 110 | 16580 | 9.82 | 4938 | 4644 | 1216.0 |
| B | 2 | 9 | 14524 | 11.75 | 4492 | 4295 | 870.3 |
| B | 3 | 80 | 11846 | 8.68 | 4492 | 4295 | 870.3 |
| B | 3 | 17 | 11770 | 8.59 | 4492 | 4295 | 870.3 |
| C | 1 | 81 | 17282 | 10.2 | 4884 | 4575 | 1246.2 |
| C | 1 | 80 | 16186 | 9.32 | 4884 | 4575 | 1246.2 |
| C | 3 | 203 | 15048 | 8.4 | 4884 | 4575 | 1246.2 |
| D | 6 | 38 | 11595 | 6.35 | 4427 | 4025 | 1192.3 |
| D | 4 | 160 | 11427 | 6.21 | 4427 | 4025 | 1192.3 |
| D | 6 | 67 | 11271 | 6.08 | 4427 | 4025 | 1192.3 |
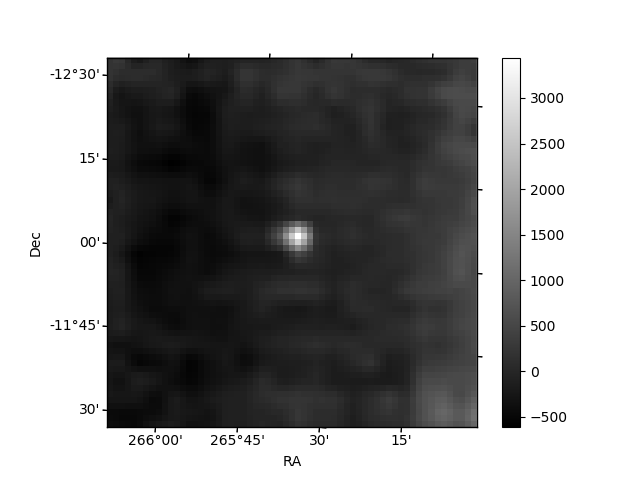
Histogram calculated using DETX and DETY for each event in the final _common_clean file
| Quadrant A |  |
 |
Quadrant B |
|---|---|---|---|
| Quadrant D |  |
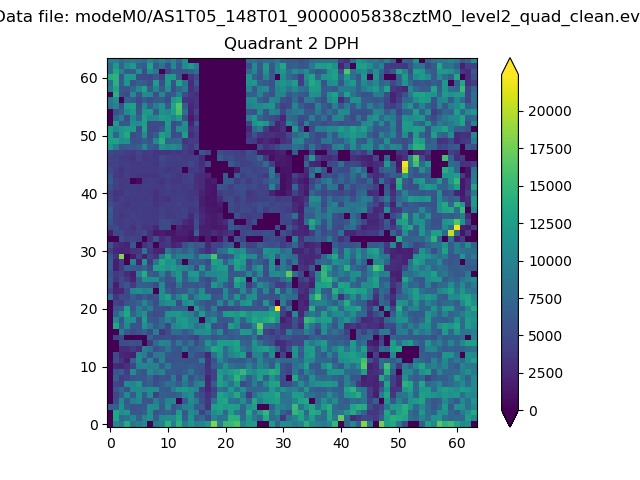 |
Quadrant C |
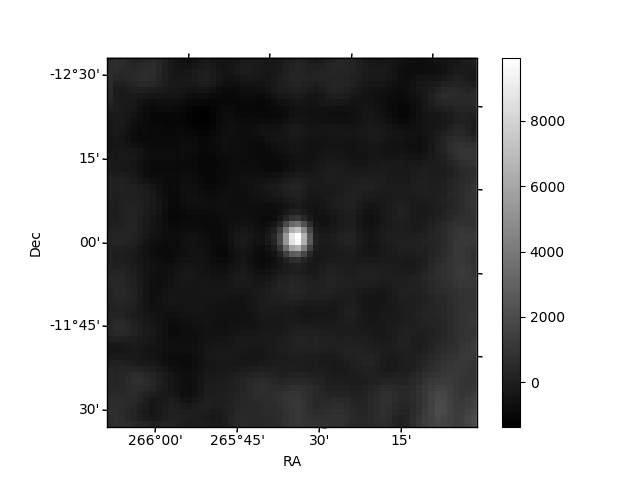
| Plot type | Count rate plots | Images |
|---|---|---|
| Comparison with Poisson distribution Blue bars denote a histogram of data divided into 1 sec bins. Red curve is a Poisson curve with rate = median count rate of data. |
 |
 |
| Quadrant-wise count rates Data is divided into 100 sec bins |
 |
|
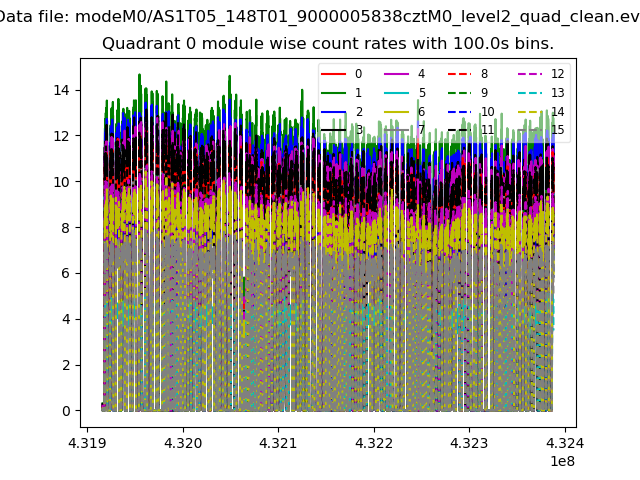
| Module-wise count rates for Quadrant A Data is divided into 100 sec bins |
 |
 |
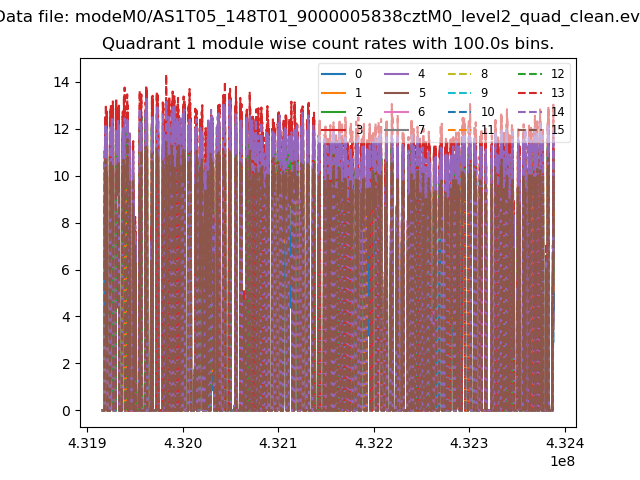
| Module-wise count rates for Quadrant B Data is divided into 100 sec bins |
 |
 |
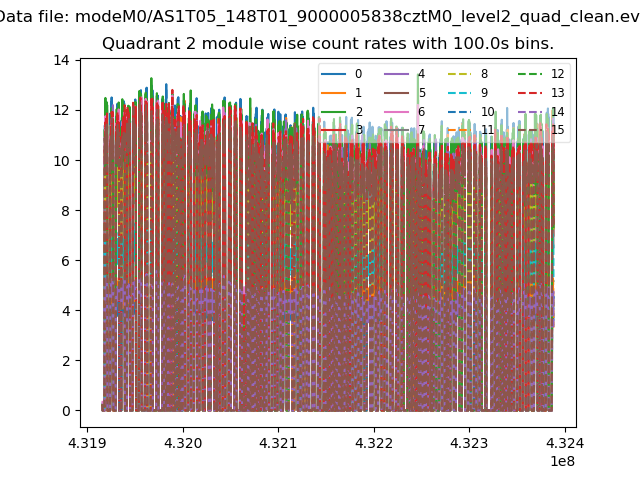
| Module-wise count rates for Quadrant C Data is divided into 100 sec bins |
 |
 |
| Module-wise count rates for Quadrant D Data is divided into 100 sec bins |
 |
 |
| Parameter | Plot |
|---|---|
| CZT HV Monitor | 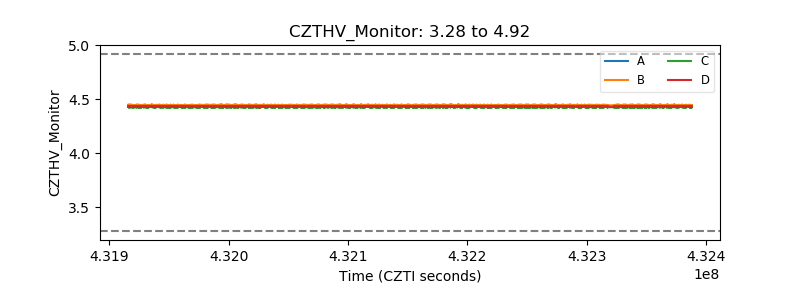 |
| D_VDD | 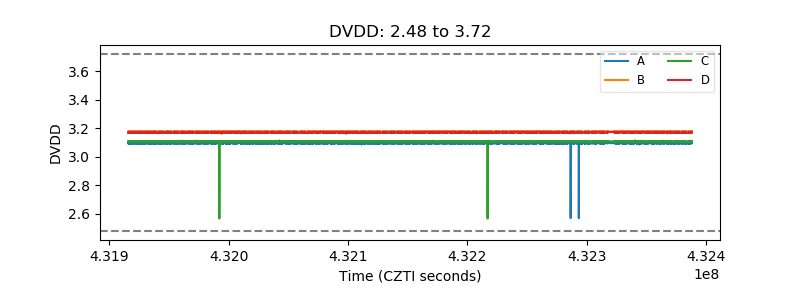 |
| Temperature 1 | 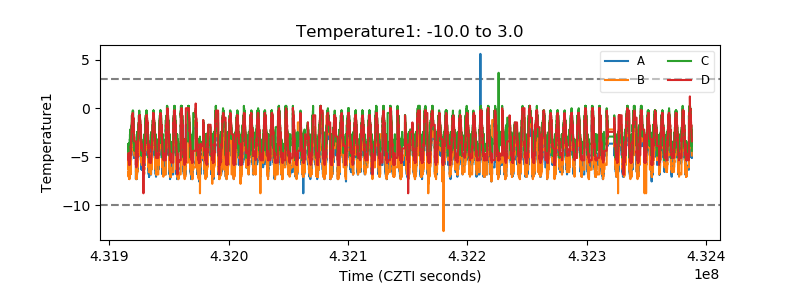 |
| Veto HV Monitor |  |
| Veto LLD | 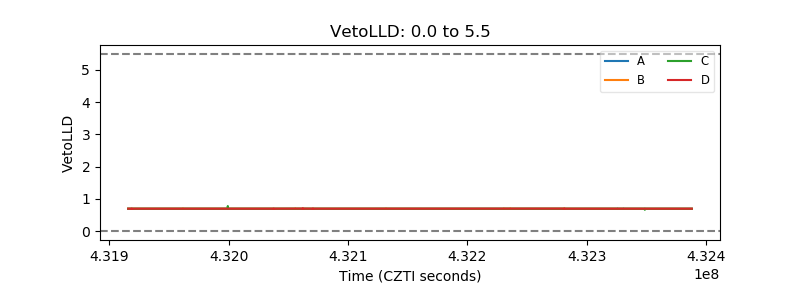 |
| Alpha Counter | 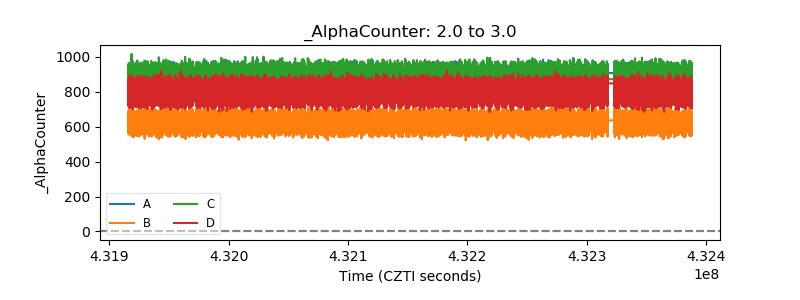 |
| _CPM_Rate |  |
| CZT Counter |  |
| +2.5 Volts monitor | 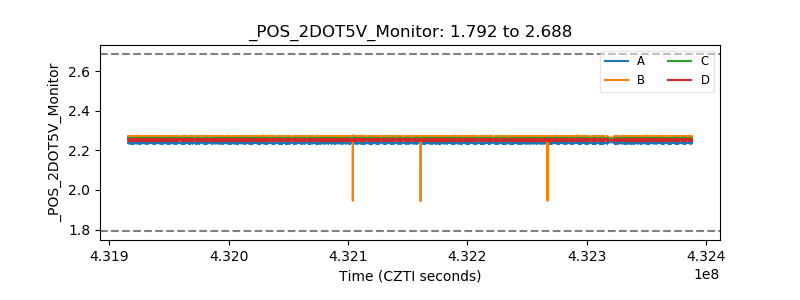 |
| +5 Volts monitor |  |
| _ROLL_ROT | 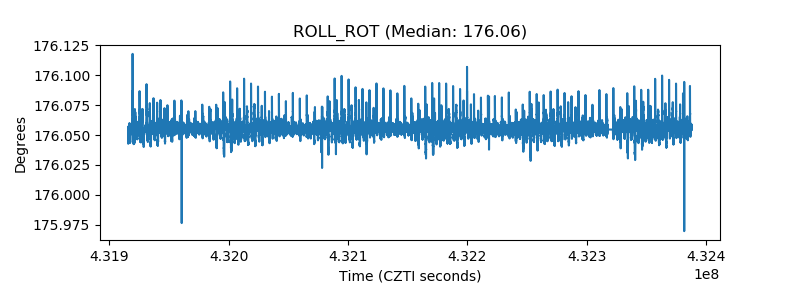 |
| _Roll_DEC |  |
| _Roll_RA |  |
| Veto Counter |  |