| Param | Original file | Final file |
|---|---|---|
| Filename | modeM0/AS1A09_006T08_9000005840cztM0_level2.fits | modeM0/AS1A09_006T08_9000005840cztM0_level2_quad_clean.evt |
| Size (bytes) | 118,756,800 | 108,832,320 |
| Size | 113.3 MB | 103.8 MB |
| Events in quadrant A | 730,466 | 666,927 |
| Events in quadrant B | 653,694 | 570,485 |
| Events in quadrant C | 718,072 | 645,100 |
| Events in quadrant D | 575,034 | 494,587 |
| Mode SS | |||
|---|---|---|---|
| Quadrant | BADHDUFLAG | Total packets | Discarded packets |
| A | 0 | 270 | 0 |
| B | 0 | 270 | 0 |
| C | 0 | 270 | 0 |
| D | 0 | 270 | 0 |
| Mode M9 | |||
|---|---|---|---|
| Quadrant | BADHDUFLAG | Total packets | Discarded packets |
| A | 0 | 65 | 0 |
| B | 0 | 66 | 0 |
| C | 0 | 66 | 0 |
| D | 0 | 66 | 0 |
| Mode M0 | |||
|---|---|---|---|
| Quadrant | BADHDUFLAG | Total packets | Discarded packets |
| A | 0 | 33165 | 0 |
| B | 0 | 40658 | 0 |
| C | 0 | 27080 | 0 |
| D | 0 | 53329 | 0 |
| Quadrant | Total seconds | Saturated seconds | Saturation percentage |
|---|---|---|---|
| A | 13292 | 230 | 1.730364% |
| B | 13292 | 1616 | 12.157689% |
| C | 13292 | 6 | 0.045140% |
| D | 13292 | 2061 | 15.505567% |
Noise dominated data is calculated using 1-second bins in cleaned event files. If a bin has >2000 counts, and if more than 50% of those come from <1% of pixels, then it is considered to be noise-dominated and hence unusable.
| Quadrant | # 1 sec bins | Bins with >0 counts | Bins with >2000 counts | High rate bins dominated by noise | Noise dominated (total time) | Noise dominated (detector-on time) | Marked lightcurve |
|---|---|---|---|---|---|---|---|
| A | 19269 | 13287 | 0 | 0 | 0.00% | 0.00% |  |
| B | 19269 | 13249 | 0 | 0 | 0.00% | 0.00% |  |
| C | 19269 | 13291 | 0 | 0 | 0.00% | 0.00% |  |
| D | 19269 | 13269 | 0 | 0 | 0.00% | 0.00% |  |
Top three noisy pixels from each quadrant. If the there are fewer than three noisy pixels in the level2.evt file, extra rows are filled as -1
| Pixel properties | Quadrant properties | ||||||
|---|---|---|---|---|---|---|---|
| Quadrant | DetID | PixID | Counts | Sigma | Mean | Median | Sigma |
| A | 0 | 29 | 637 | 9.18 | 190 | 179 | 49.9 |
| A | 9 | 19 | 617 | 8.78 | 190 | 179 | 49.9 |
| A | 0 | 30 | 583 | 8.1 | 190 | 179 | 49.9 |
| B | 2 | 9 | 572 | 11.34 | 172 | 164 | 36.0 |
| B | 5 | 128 | 463 | 8.31 | 172 | 164 | 36.0 |
| B | 3 | 17 | 451 | 7.97 | 172 | 164 | 36.0 |
| C | 1 | 80 | 611 | 8.58 | 189 | 178 | 50.5 |
| C | 1 | 81 | 608 | 8.52 | 189 | 178 | 50.5 |
| C | 3 | 203 | 575 | 7.86 | 189 | 178 | 50.5 |
| D | 6 | 38 | 428 | 6.04 | 164 | 149 | 46.2 |
| D | 10 | 189 | 424 | 5.96 | 164 | 149 | 46.2 |
| D | 6 | 62 | 423 | 5.94 | 164 | 149 | 46.2 |
Histogram calculated using DETX and DETY for each event in the final _common_clean file
| Quadrant A |  |
 |
Quadrant B |
|---|---|---|---|
| Quadrant D | 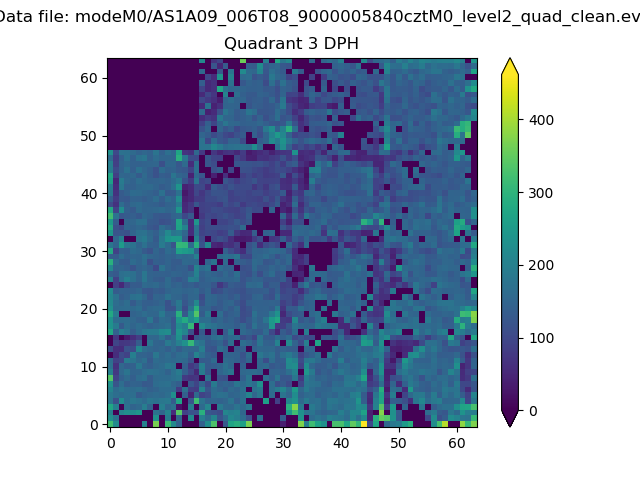 |
 |
Quadrant C |
| Plot type | Count rate plots | Images |
|---|---|---|
| Comparison with Poisson distribution Blue bars denote a histogram of data divided into 1 sec bins. Red curve is a Poisson curve with rate = median count rate of data. |
 |
 |
| Quadrant-wise count rates Data is divided into 100 sec bins |
 |
|
| Module-wise count rates for Quadrant A Data is divided into 100 sec bins |
 |
 |
| Module-wise count rates for Quadrant B Data is divided into 100 sec bins |
 |
 |
| Module-wise count rates for Quadrant C Data is divided into 100 sec bins |
 |
 |
| Module-wise count rates for Quadrant D Data is divided into 100 sec bins |
 |
 |
| Parameter | Plot |
|---|---|
| CZT HV Monitor |  |
| D_VDD |  |
| Temperature 1 |  |
| Veto HV Monitor |  |
| Veto LLD |  |
| Alpha Counter |  |
| _CPM_Rate |  |
| CZT Counter |  |
| +2.5 Volts monitor |  |
| +5 Volts monitor |  |
| _ROLL_ROT |  |
| _Roll_DEC |  |
| _Roll_RA |  |
| Veto Counter |  |