| Param | Original file | Final file |
|---|---|---|
| Filename | modeM0/AS1A09_006T09_9000005842cztM0_level2.fits | modeM0/AS1A09_006T09_9000005842cztM0_level2_quad_clean.evt |
| Size (bytes) | 239,034,240 | 248,146,560 |
| Size | 228.0 MB | 236.7 MB |
| Events in quadrant A | 1,409,558 | 1,439,633 |
| Events in quadrant B | 1,356,442 | 1,450,425 |
| Events in quadrant C | 1,412,190 | 1,506,663 |
| Events in quadrant D | 1,164,918 | 1,223,102 |
| Mode SS | |||
|---|---|---|---|
| Quadrant | BADHDUFLAG | Total packets | Discarded packets |
| A | 0 | 560 | 0 |
| B | 0 | 560 | 0 |
| C | 0 | 560 | 0 |
| D | 0 | 560 | 0 |
| Mode M0 | |||
|---|---|---|---|
| Quadrant | BADHDUFLAG | Total packets | Discarded packets |
| A | 0 | 62754 | 0 |
| B | 0 | 61103 | 0 |
| C | 0 | 56099 | 0 |
| D | 0 | 90385 | 0 |
| Mode M9 | |||
|---|---|---|---|
| Quadrant | BADHDUFLAG | Total packets | Discarded packets |
| A | 0 | 70 | 0 |
| B | 0 | 70 | 0 |
| C | 0 | 70 | 0 |
| D | 0 | 70 | 0 |
| Quadrant | Total seconds | Saturated seconds | Saturation percentage |
|---|---|---|---|
| A | 27561 | 301 | 1.092123% |
| B | 27561 | 540 | 1.959290% |
| C | 27561 | 27 | 0.097965% |
| D | 27561 | 2493 | 9.045390% |
Noise dominated data is calculated using 1-second bins in cleaned event files. If a bin has >2000 counts, and if more than 50% of those come from <1% of pixels, then it is considered to be noise-dominated and hence unusable.
| Quadrant | # 1 sec bins | Bins with >0 counts | Bins with >2000 counts | High rate bins dominated by noise | Noise dominated (total time) | Noise dominated (detector-on time) | Marked lightcurve |
|---|---|---|---|---|---|---|---|
| A | 34510 | 27550 | 0 | 0 | 0.00% | 0.00% | 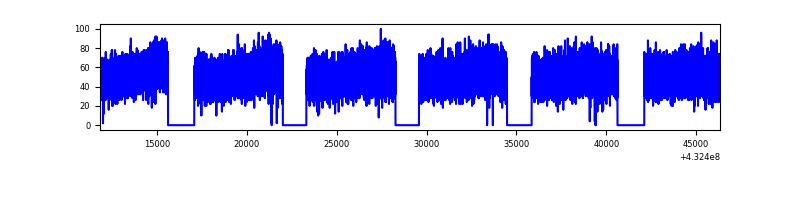 |
| B | 34510 | 27556 | 0 | 0 | 0.00% | 0.00% | 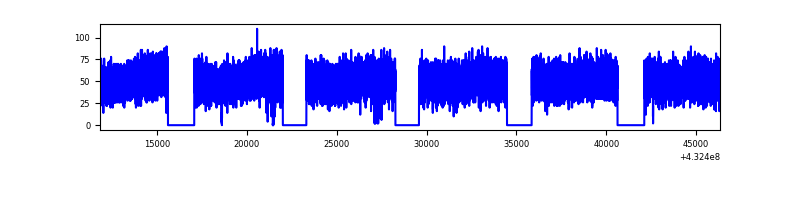 |
| C | 34510 | 27561 | 0 | 0 | 0.00% | 0.00% | 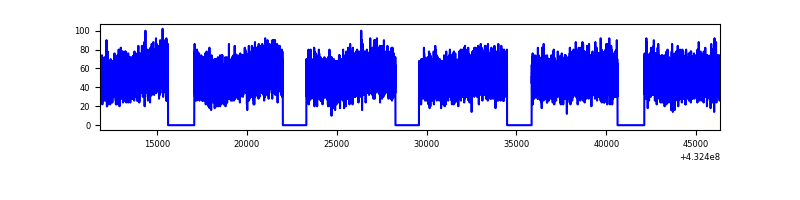 |
| D | 34510 | 27486 | 0 | 0 | 0.00% | 0.00% |  |
Top three noisy pixels from each quadrant. If the there are fewer than three noisy pixels in the level2.evt file, extra rows are filled as -1
| Pixel properties | Quadrant properties | ||||||
|---|---|---|---|---|---|---|---|
| Quadrant | DetID | PixID | Counts | Sigma | Mean | Median | Sigma |
| A | 0 | 29 | 1183 | 8.91 | 368 | 345 | 94.1 |
| A | 7 | 110 | 1132 | 8.37 | 368 | 345 | 94.1 |
| A | 9 | 19 | 1124 | 8.28 | 368 | 345 | 94.1 |
| B | 2 | 9 | 1219 | 12.13 | 358 | 342 | 72.3 |
| B | 2 | 8 | 972 | 8.72 | 358 | 342 | 72.3 |
| B | 3 | 80 | 961 | 8.57 | 358 | 342 | 72.3 |
| C | 1 | 81 | 1179 | 8.47 | 373 | 348 | 98.1 |
| C | 3 | 202 | 1169 | 8.37 | 373 | 348 | 98.1 |
| C | 3 | 203 | 1168 | 8.36 | 373 | 348 | 98.1 |
| D | 10 | 189 | 878 | 6.4 | 332 | 302 | 89.9 |
| D | 3 | 14 | 874 | 6.36 | 332 | 302 | 89.9 |
| D | 7 | 3 | 851 | 6.1 | 332 | 302 | 89.9 |
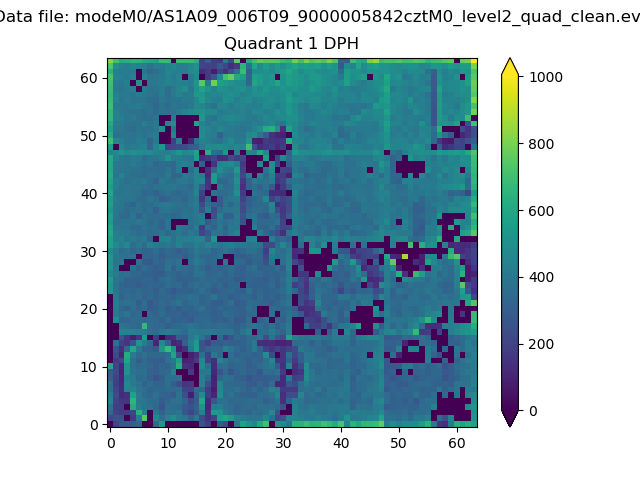
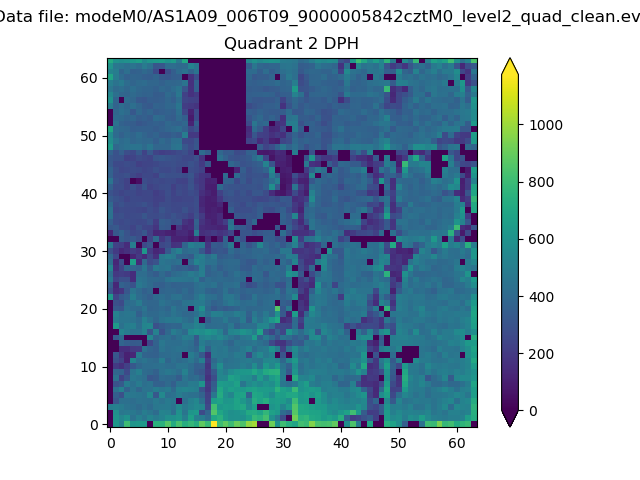
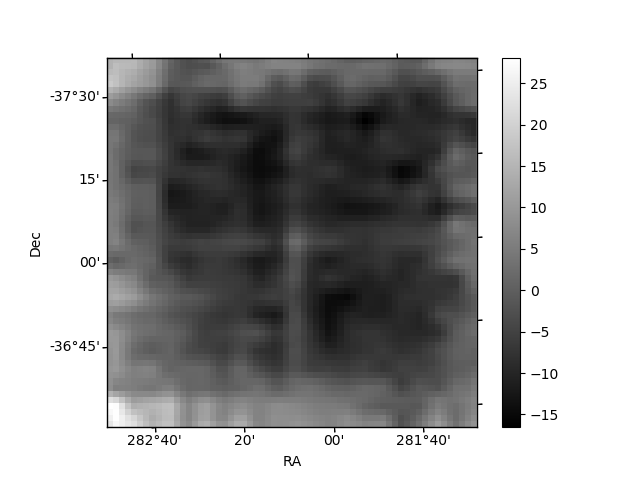
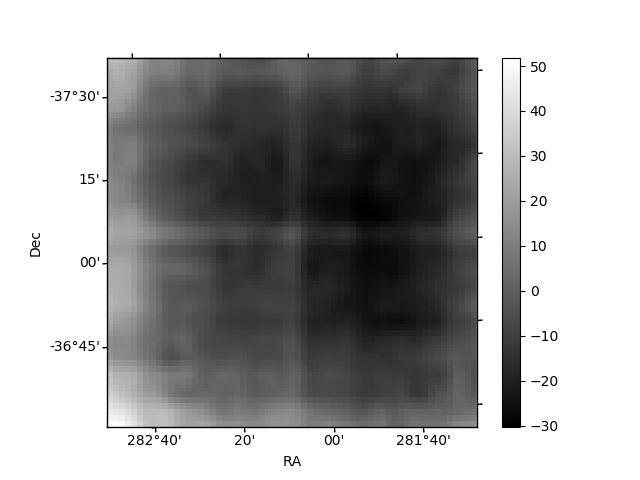
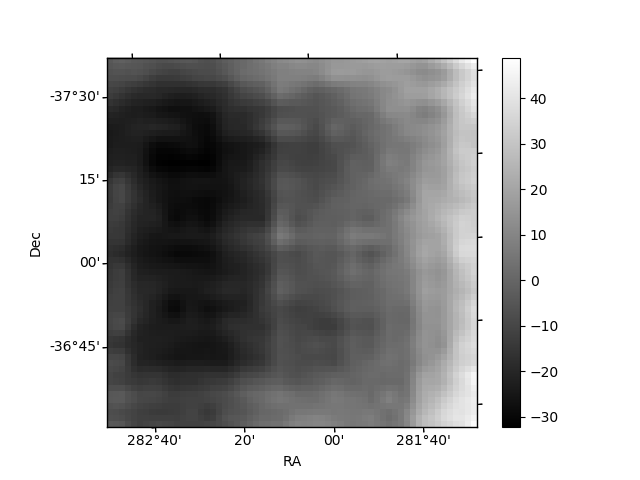
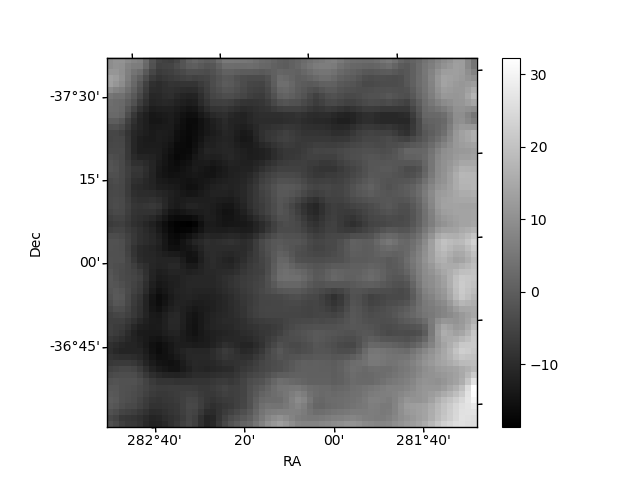
Histogram calculated using DETX and DETY for each event in the final _common_clean file
| Quadrant A | 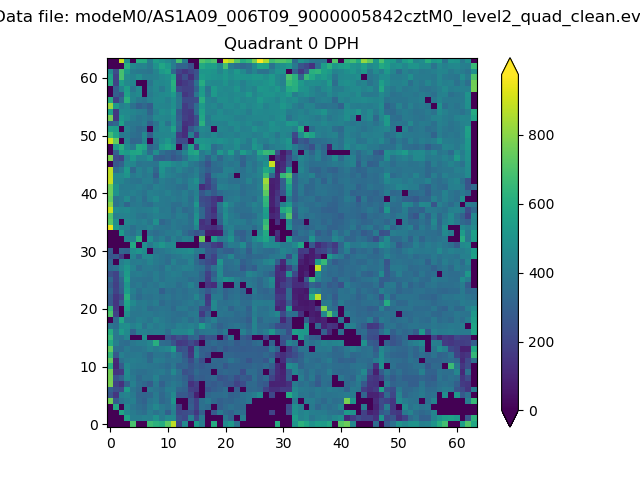 |
 |
Quadrant B |
|---|---|---|---|
| Quadrant D | 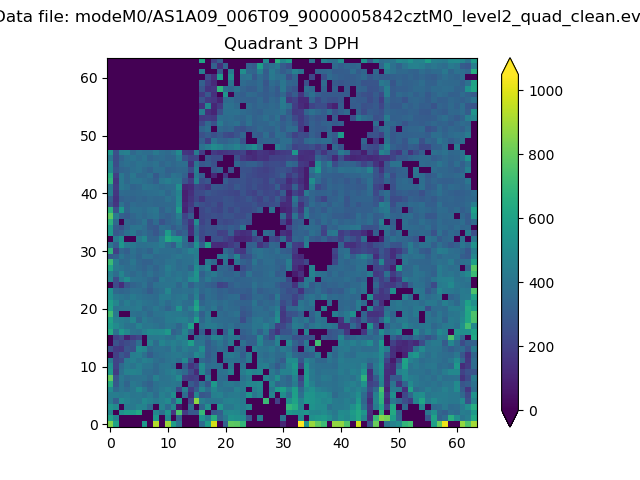 |
 |
Quadrant C |
| Plot type | Count rate plots | Images |
|---|---|---|
| Comparison with Poisson distribution Blue bars denote a histogram of data divided into 1 sec bins. Red curve is a Poisson curve with rate = median count rate of data. |
 |
 |
| Quadrant-wise count rates Data is divided into 100 sec bins |
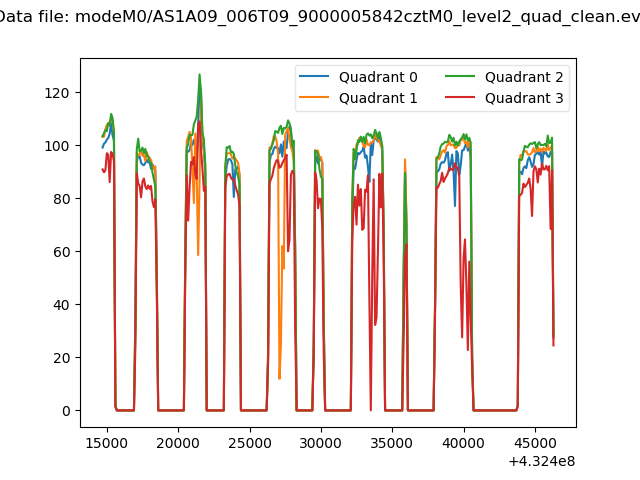 |
|
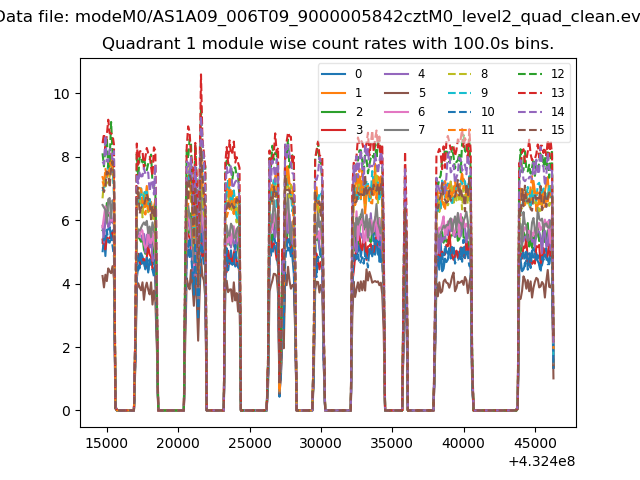
| Module-wise count rates for Quadrant A Data is divided into 100 sec bins |
 |
 |
| Module-wise count rates for Quadrant B Data is divided into 100 sec bins |
 |
 |
| Module-wise count rates for Quadrant C Data is divided into 100 sec bins |
 |
 |
| Module-wise count rates for Quadrant D Data is divided into 100 sec bins |
 |
 |
| Parameter | Plot |
|---|---|
| CZT HV Monitor | 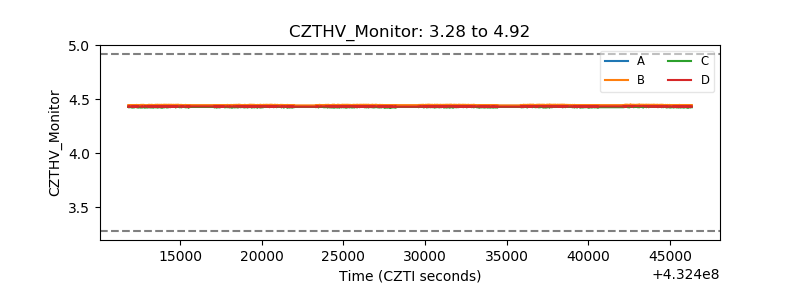 |
| D_VDD | 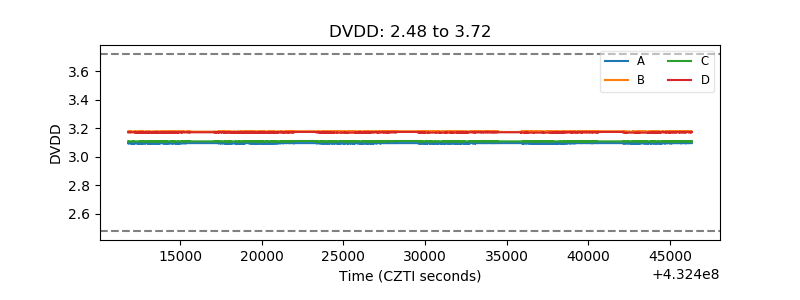 |
| Temperature 1 | 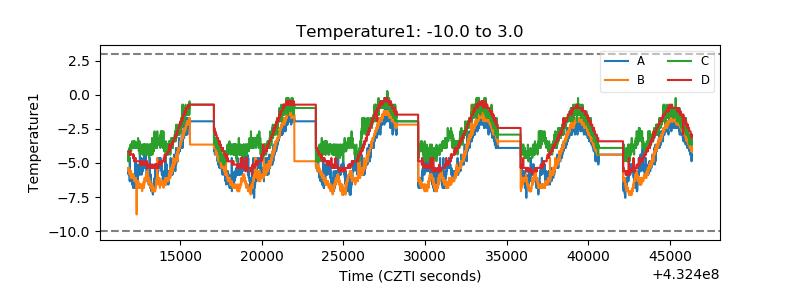 |
| Veto HV Monitor | 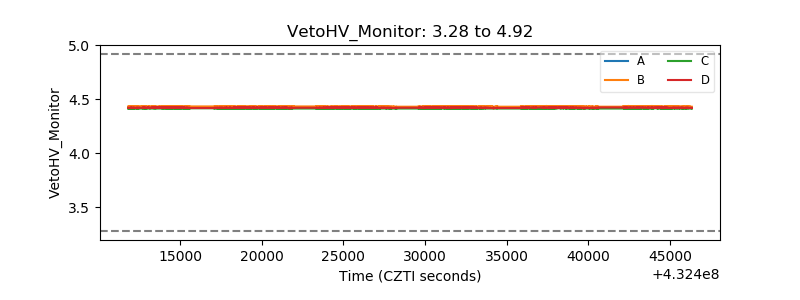 |
| Veto LLD | 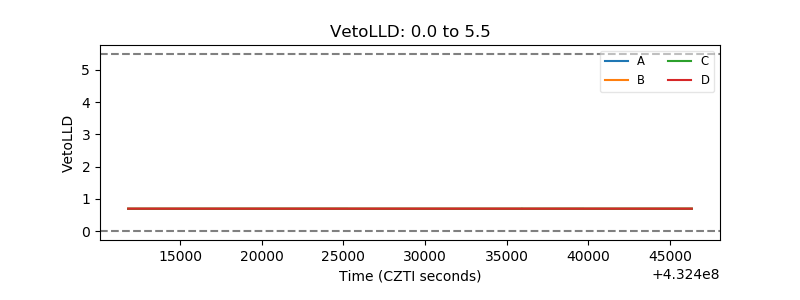 |
| Alpha Counter |  |
| _CPM_Rate | 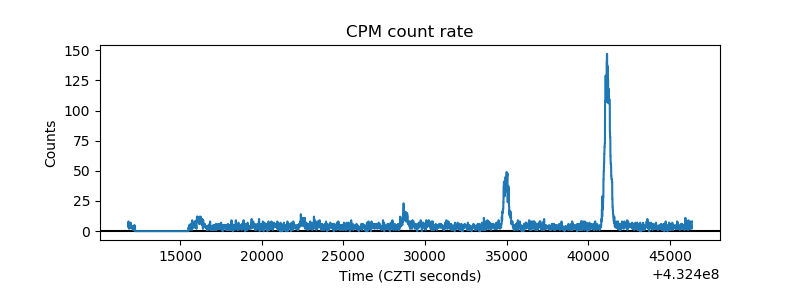 |
| CZT Counter | 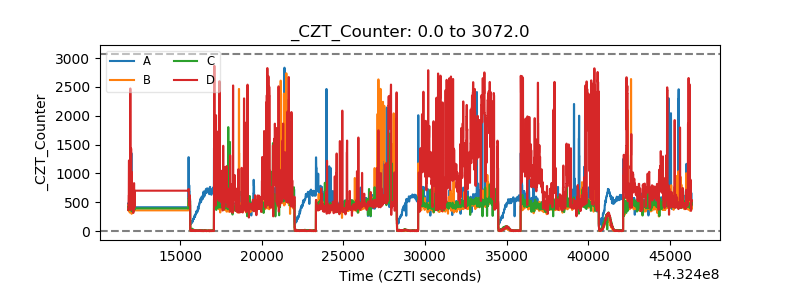 |
| +2.5 Volts monitor | 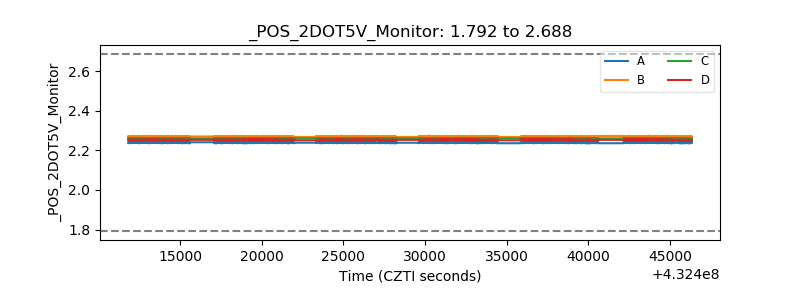 |
| +5 Volts monitor | 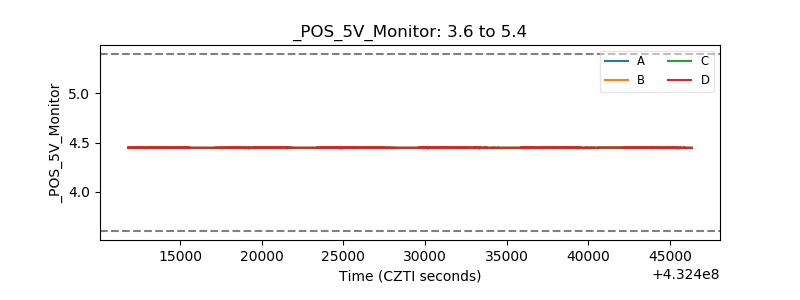 |
| _ROLL_ROT |  |
| _Roll_DEC | 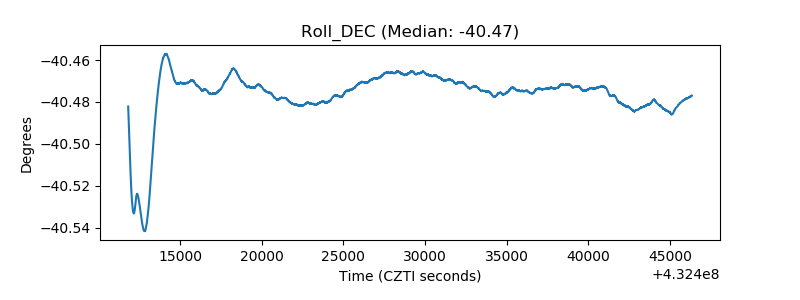 |
| _Roll_RA | 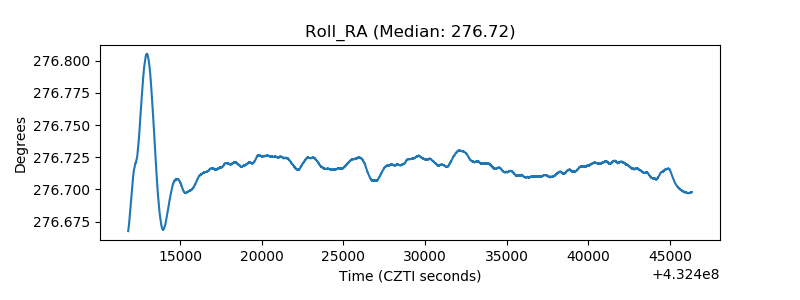 |
| Veto Counter |  |