| Param | Original file | Final file |
|---|---|---|
| Filename | modeM0/AS1A09_006T07_9000005852cztM0_level2.fits | modeM0/AS1A09_006T07_9000005852cztM0_level2_quad_clean.evt |
| Size (bytes) | 327,165,120 | 350,343,360 |
| Size | 312.0 MB | 334.1 MB |
| Events in quadrant A | 1,843,314 | 1,987,847 |
| Events in quadrant B | 1,895,860 | 2,165,224 |
| Events in quadrant C | 1,943,776 | 2,051,058 |
| Events in quadrant D | 1,672,984 | 1,855,678 |
| Mode M9 | |||
|---|---|---|---|
| Quadrant | BADHDUFLAG | Total packets | Discarded packets |
| A | 0 | 158 | 0 |
| B | 0 | 158 | 0 |
| C | 0 | 158 | 0 |
| D | 0 | 158 | 0 |
| Mode M0 | |||
|---|---|---|---|
| Quadrant | BADHDUFLAG | Total packets | Discarded packets |
| A | 0 | 118226 | 0 |
| B | 0 | 82582 | 0 |
| C | 0 | 75986 | 0 |
| D | 0 | 95923 | 0 |
| Mode SS | |||
|---|---|---|---|
| Quadrant | BADHDUFLAG | Total packets | Discarded packets |
| A | 0 | 756 | 0 |
| B | 0 | 756 | 0 |
| C | 0 | 756 | 0 |
| D | 0 | 756 | 0 |
| Quadrant | Total seconds | Saturated seconds | Saturation percentage |
|---|---|---|---|
| A | 37141 | 4002 | 10.775154% |
| B | 37141 | 288 | 0.775423% |
| C | 37141 | 55 | 0.148084% |
| D | 37141 | 946 | 2.547050% |
Noise dominated data is calculated using 1-second bins in cleaned event files. If a bin has >2000 counts, and if more than 50% of those come from <1% of pixels, then it is considered to be noise-dominated and hence unusable.
| Quadrant | # 1 sec bins | Bins with >0 counts | Bins with >2000 counts | High rate bins dominated by noise | Noise dominated (total time) | Noise dominated (detector-on time) | Marked lightcurve |
|---|---|---|---|---|---|---|---|
| A | 50974 | 36558 | 0 | 0 | 0.00% | 0.00% |  |
| B | 50975 | 37139 | 0 | 0 | 0.00% | 0.00% |  |
| C | 50975 | 37139 | 0 | 0 | 0.00% | 0.00% |  |
| D | 50975 | 37135 | 0 | 0 | 0.00% | 0.00% |  |
Top three noisy pixels from each quadrant. If the there are fewer than three noisy pixels in the level2.evt file, extra rows are filled as -1
| Pixel properties | Quadrant properties | ||||||
|---|---|---|---|---|---|---|---|
| Quadrant | DetID | PixID | Counts | Sigma | Mean | Median | Sigma |
| A | 7 | 110 | 1526 | 8.78 | 480 | 450 | 122.6 |
| A | 9 | 19 | 1504 | 8.6 | 480 | 450 | 122.6 |
| A | 0 | 29 | 1496 | 8.53 | 480 | 450 | 122.6 |
| B | 2 | 9 | 1585 | 10.97 | 501 | 477 | 101.0 |
| B | 5 | 128 | 1327 | 8.41 | 501 | 477 | 101.0 |
| B | 3 | 17 | 1317 | 8.31 | 501 | 477 | 101.0 |
| C | 1 | 81 | 1602 | 8.4 | 513 | 478 | 133.8 |
| C | 1 | 80 | 1590 | 8.31 | 513 | 478 | 133.8 |
| C | 3 | 202 | 1546 | 7.98 | 513 | 478 | 133.8 |
| D | 4 | 160 | 1232 | 6.22 | 477 | 434 | 128.3 |
| D | 10 | 189 | 1228 | 6.19 | 477 | 434 | 128.3 |
| D | 7 | 3 | 1206 | 6.02 | 477 | 434 | 128.3 |
Histogram calculated using DETX and DETY for each event in the final _common_clean file
| Quadrant A |  |
 |
Quadrant B |
|---|---|---|---|
| Quadrant D | 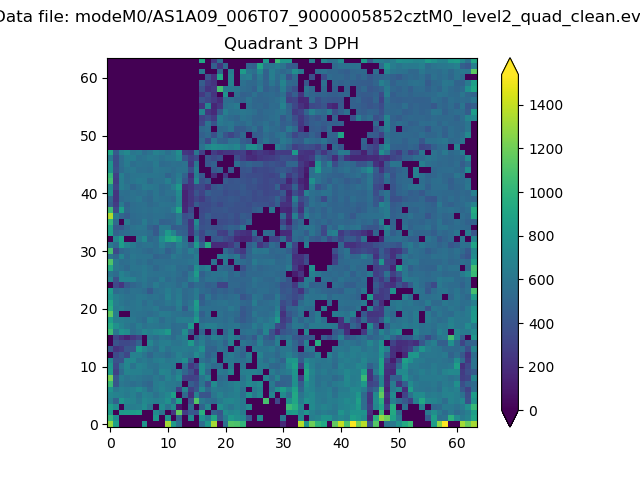 |
 |
Quadrant C |
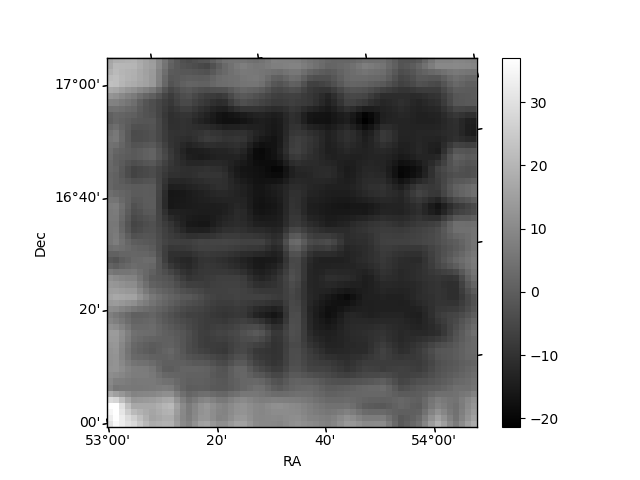
| Plot type | Count rate plots | Images |
|---|---|---|
| Comparison with Poisson distribution Blue bars denote a histogram of data divided into 1 sec bins. Red curve is a Poisson curve with rate = median count rate of data. |
 |
 |
| Quadrant-wise count rates Data is divided into 100 sec bins |
 |
|
| Module-wise count rates for Quadrant A Data is divided into 100 sec bins |
 |
 |
| Module-wise count rates for Quadrant B Data is divided into 100 sec bins |
 |
 |
| Module-wise count rates for Quadrant C Data is divided into 100 sec bins |
 |
 |
| Module-wise count rates for Quadrant D Data is divided into 100 sec bins |
 |
 |
| Parameter | Plot |
|---|---|
| CZT HV Monitor |  |
| D_VDD |  |
| Temperature 1 |  |
| Veto HV Monitor |  |
| Veto LLD |  |
| Alpha Counter |  |
| _CPM_Rate |  |
| CZT Counter |  |
| +2.5 Volts monitor |  |
| +5 Volts monitor |  |
| _ROLL_ROT |  |
| _Roll_DEC |  |
| _Roll_RA |  |
| Veto Counter |  |