| Param | Original file | Final file |
|---|---|---|
| Filename | modeM0/AS1C07_001T10_9000005856cztM0_level2.fits | modeM0/AS1C07_001T10_9000005856cztM0_level2_quad_clean.evt |
| Size (bytes) | 1,171,696,320 | 1,529,847,360 |
| Size | 1.1 GB | 1.4 GB |
| Events in quadrant A | 6,783,494 | 9,392,710 |
| Events in quadrant B | 6,733,328 | 9,972,632 |
| Events in quadrant C | 6,766,052 | 9,261,799 |
| Events in quadrant D | 5,888,086 | 8,402,111 |
| Mode M9 | |||
|---|---|---|---|
| Quadrant | BADHDUFLAG | Total packets | Discarded packets |
| A | 0 | 495 | 0 |
| B | 0 | 497 | 0 |
| C | 0 | 496 | 0 |
| D | 0 | 496 | 0 |
| Mode SS | |||
|---|---|---|---|
| Quadrant | BADHDUFLAG | Total packets | Discarded packets |
| A | 0 | 2776 | 0 |
| B | 0 | 2778 | 0 |
| C | 0 | 2776 | 0 |
| D | 0 | 2778 | 0 |
| Mode M0 | |||
|---|---|---|---|
| Quadrant | BADHDUFLAG | Total packets | Discarded packets |
| A | 0 | 377817 | 0 |
| B | 0 | 297462 | 0 |
| C | 0 | 296205 | 0 |
| D | 0 | 341765 | 0 |
| Quadrant | Total seconds | Saturated seconds | Saturation percentage |
|---|---|---|---|
| A | 135817 | 8290 | 6.103801% |
| B | 135852 | 1675 | 1.232959% |
| C | 135832 | 765 | 0.563196% |
| D | 135823 | 5216 | 3.840292% |
Noise dominated data is calculated using 1-second bins in cleaned event files. If a bin has >2000 counts, and if more than 50% of those come from <1% of pixels, then it is considered to be noise-dominated and hence unusable.
| Quadrant | # 1 sec bins | Bins with >0 counts | Bins with >2000 counts | High rate bins dominated by noise | Noise dominated (total time) | Noise dominated (detector-on time) | Marked lightcurve |
|---|---|---|---|---|---|---|---|
| A | 193398 | 135554 | 0 | 0 | 0.00% | 0.00% |  |
| B | 193399 | 135868 | 0 | 0 | 0.00% | 0.00% |  |
| C | 193399 | 135905 | 0 | 0 | 0.00% | 0.00% |  |
| D | 193399 | 135672 | 0 | 0 | 0.00% | 0.00% |  |
Top three noisy pixels from each quadrant. If the there are fewer than three noisy pixels in the level2.evt file, extra rows are filled as -1
| Pixel properties | Quadrant properties | ||||||
|---|---|---|---|---|---|---|---|
| Quadrant | DetID | PixID | Counts | Sigma | Mean | Median | Sigma |
| A | 0 | 29 | 5715 | 9.1 | 1770 | 1661 | 445.3 |
| A | 7 | 110 | 5685 | 9.04 | 1770 | 1661 | 445.3 |
| A | 9 | 19 | 5526 | 8.68 | 1770 | 1661 | 445.3 |
| B | 2 | 9 | 5804 | 12.01 | 1777 | 1699 | 341.9 |
| B | 3 | 80 | 4792 | 9.05 | 1777 | 1699 | 341.9 |
| B | 2 | 8 | 4668 | 8.68 | 1777 | 1699 | 341.9 |
| C | 1 | 81 | 5602 | 8.65 | 1788 | 1673 | 454.2 |
| C | 1 | 80 | 5444 | 8.3 | 1788 | 1673 | 454.2 |
| C | 3 | 203 | 5357 | 8.11 | 1788 | 1673 | 454.2 |
| D | 10 | 189 | 4520 | 6.57 | 1684 | 1528 | 455.1 |
| D | 4 | 160 | 4455 | 6.43 | 1684 | 1528 | 455.1 |
| D | 3 | 14 | 4321 | 6.14 | 1684 | 1528 | 455.1 |
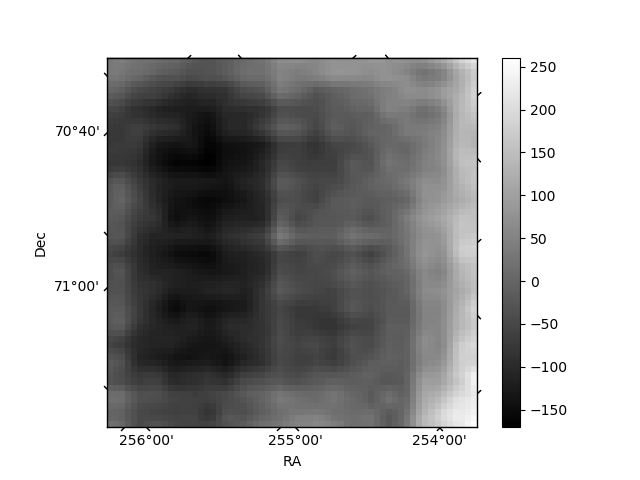
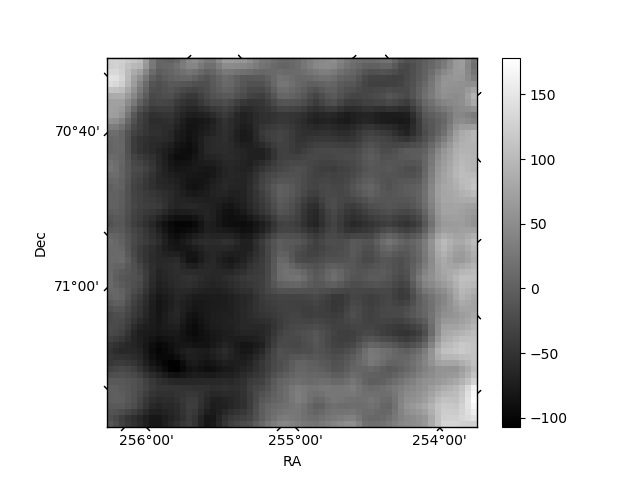
Histogram calculated using DETX and DETY for each event in the final _common_clean file
| Quadrant A | 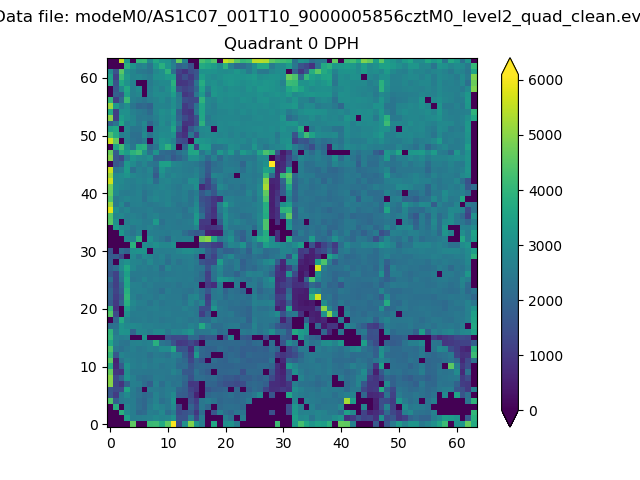 |
 |
Quadrant B |
|---|---|---|---|
| Quadrant D | 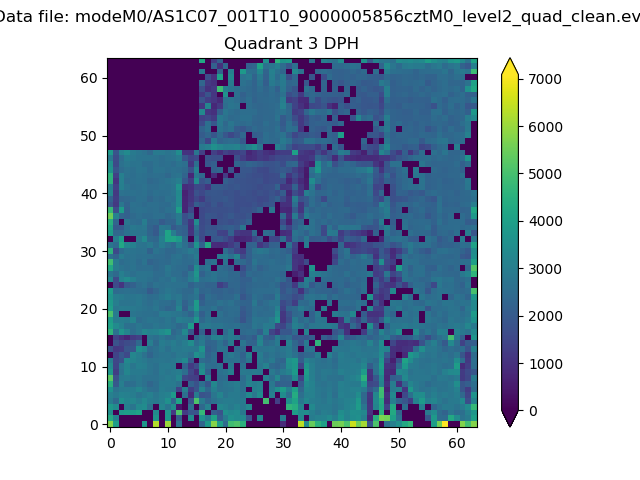 |
 |
Quadrant C |
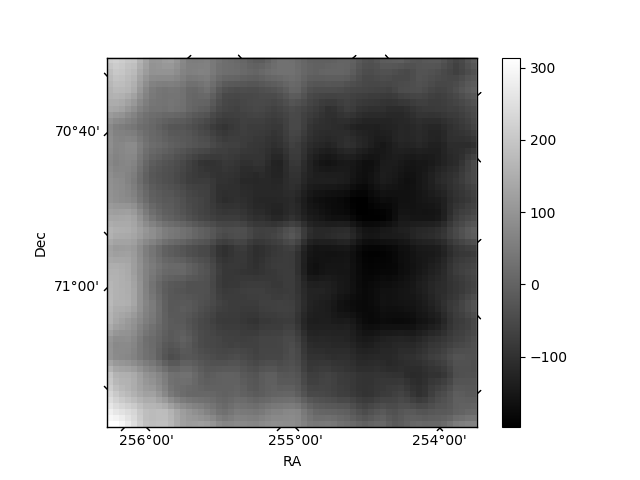
| Plot type | Count rate plots | Images |
|---|---|---|
| Comparison with Poisson distribution Blue bars denote a histogram of data divided into 1 sec bins. Red curve is a Poisson curve with rate = median count rate of data. |
 |
 |
| Quadrant-wise count rates Data is divided into 100 sec bins |
 |
|
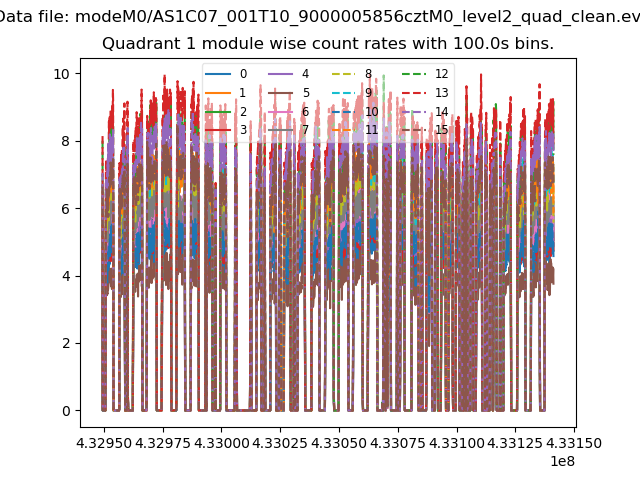
| Module-wise count rates for Quadrant A Data is divided into 100 sec bins |
 |
 |
| Module-wise count rates for Quadrant B Data is divided into 100 sec bins |
 |
 |
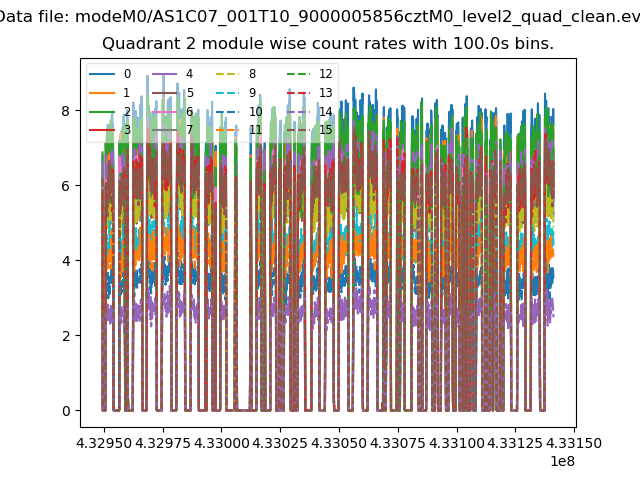
| Module-wise count rates for Quadrant C Data is divided into 100 sec bins |
 |
 |
| Module-wise count rates for Quadrant D Data is divided into 100 sec bins |
 |
 |
| Parameter | Plot |
|---|---|
| CZT HV Monitor | 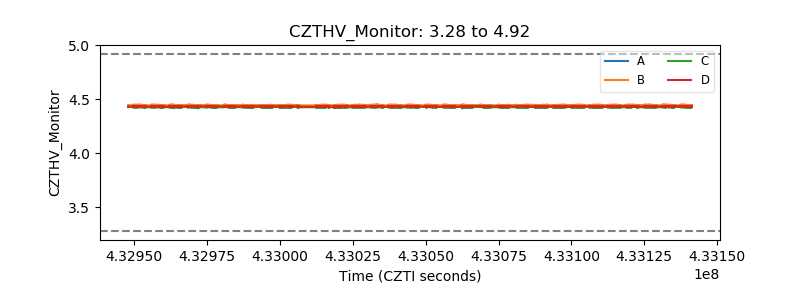 |
| D_VDD | 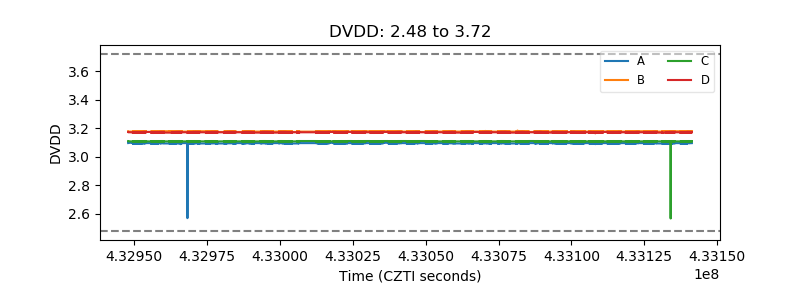 |
| Temperature 1 |  |
| Veto HV Monitor | 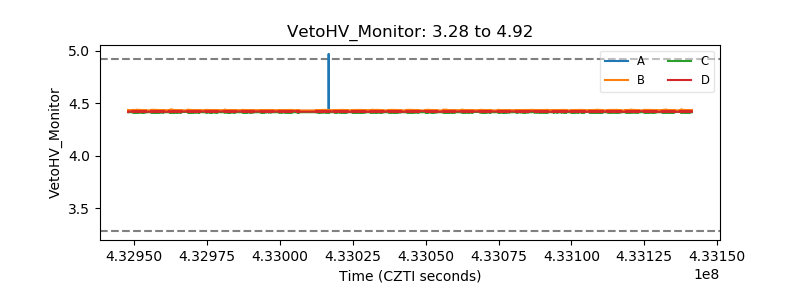 |
| Veto LLD | 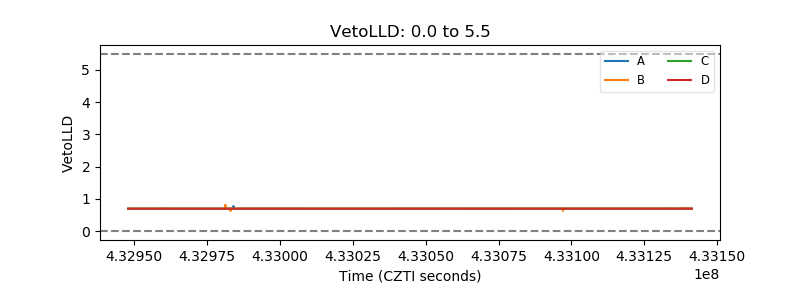 |
| Alpha Counter |  |
| _CPM_Rate |  |
| CZT Counter | 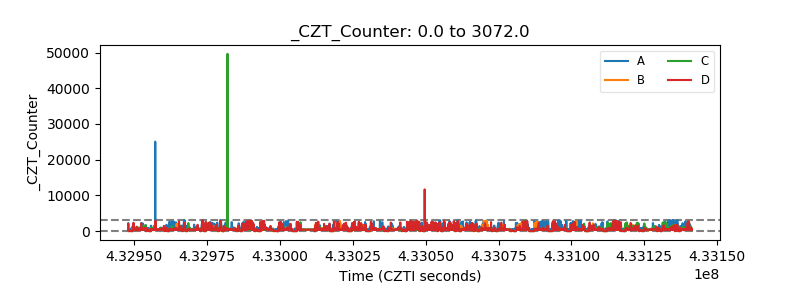 |
| +2.5 Volts monitor | 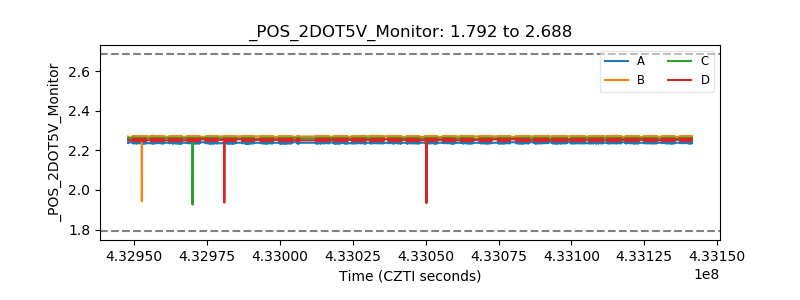 |
| +5 Volts monitor |  |
| _ROLL_ROT | 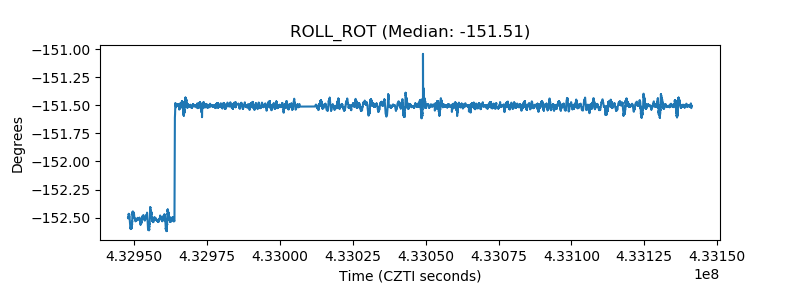 |
| _Roll_DEC | 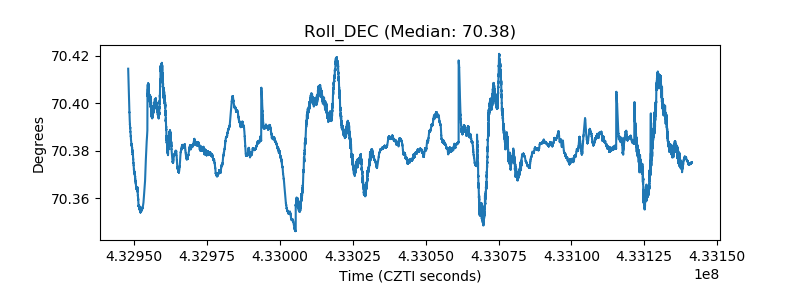 |
| _Roll_RA |  |
| Veto Counter | 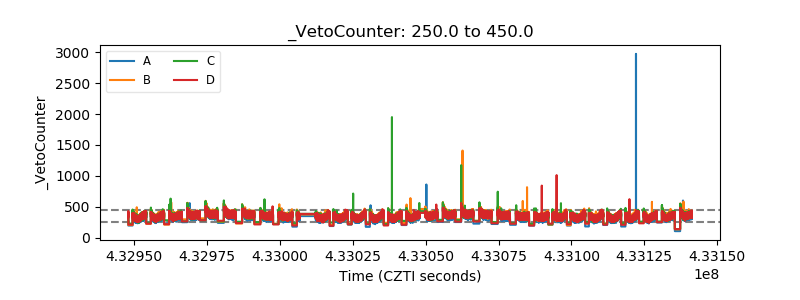 |