| Param | Original file | Final file |
|---|---|---|
| Filename | modeM0/AS1A09_036T17_9000005858cztM0_level2.fits | modeM0/AS1A09_036T17_9000005858cztM0_level2_quad_clean.evt |
| Size (bytes) | 1,335,726,720 | 1,380,320,640 |
| Size | 1.2 GB | 1.3 GB |
| Events in quadrant A | 7,731,278 | 8,016,066 |
| Events in quadrant B | 7,597,770 | 8,368,146 |
| Events in quadrant C | 7,922,286 | 7,874,872 |
| Events in quadrant D | 6,803,982 | 7,154,803 |
| Mode M0 | |||
|---|---|---|---|
| Quadrant | BADHDUFLAG | Total packets | Discarded packets |
| A | 0 | 429368 | 0 |
| B | 0 | 359339 | 0 |
| C | 0 | 313856 | 0 |
| D | 0 | 382500 | 0 |
| Mode SS | |||
|---|---|---|---|
| Quadrant | BADHDUFLAG | Total packets | Discarded packets |
| A | 0 | 3104 | 0 |
| B | 0 | 3104 | 0 |
| C | 0 | 3104 | 0 |
| D | 0 | 3104 | 0 |
| Mode M9 | |||
|---|---|---|---|
| Quadrant | BADHDUFLAG | Total packets | Discarded packets |
| A | 0 | 582 | 0 |
| B | 0 | 582 | 0 |
| C | 0 | 582 | 0 |
| D | 0 | 582 | 0 |
| Quadrant | Total seconds | Saturated seconds | Saturation percentage |
|---|---|---|---|
| A | 151642 | 8881 | 5.856557% |
| B | 151644 | 4192 | 2.764369% |
| C | 151646 | 419 | 0.276301% |
| D | 151643 | 4345 | 2.865282% |
Noise dominated data is calculated using 1-second bins in cleaned event files. If a bin has >2000 counts, and if more than 50% of those come from <1% of pixels, then it is considered to be noise-dominated and hence unusable.
| Quadrant | # 1 sec bins | Bins with >0 counts | Bins with >2000 counts | High rate bins dominated by noise | Noise dominated (total time) | Noise dominated (detector-on time) | Marked lightcurve |
|---|---|---|---|---|---|---|---|
| A | 209089 | 151357 | 0 | 0 | 0.00% | 0.00% |  |
| B | 209089 | 151603 | 0 | 0 | 0.00% | 0.00% |  |
| C | 209089 | 151640 | 0 | 0 | 0.00% | 0.00% |  |
| D | 209089 | 151560 | 0 | 0 | 0.00% | 0.00% | 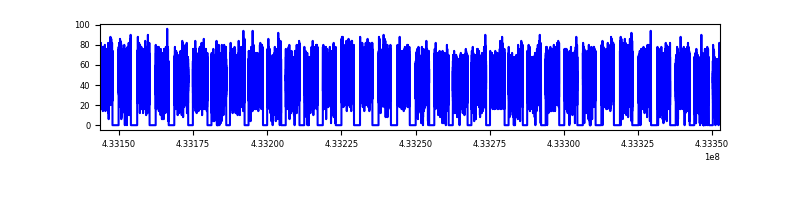 |
Top three noisy pixels from each quadrant. If the there are fewer than three noisy pixels in the level2.evt file, extra rows are filled as -1
| Pixel properties | Quadrant properties | ||||||
|---|---|---|---|---|---|---|---|
| Quadrant | DetID | PixID | Counts | Sigma | Mean | Median | Sigma |
| A | 9 | 19 | 6488 | 9.15 | 2020 | 1888 | 502.6 |
| A | 7 | 110 | 6404 | 8.98 | 2020 | 1888 | 502.6 |
| A | 0 | 29 | 6355 | 8.89 | 2020 | 1888 | 502.6 |
| B | 2 | 9 | 6551 | 11.93 | 2009 | 1910 | 389.1 |
| B | 5 | 128 | 5474 | 9.16 | 2009 | 1910 | 389.1 |
| B | 3 | 80 | 5446 | 9.09 | 2009 | 1910 | 389.1 |
| C | 1 | 81 | 6550 | 8.65 | 2090 | 1948 | 531.9 |
| C | 3 | 203 | 6324 | 8.23 | 2090 | 1948 | 531.9 |
| C | 1 | 80 | 6314 | 8.21 | 2090 | 1948 | 531.9 |
| D | 10 | 189 | 5106 | 6.44 | 1950 | 1778 | 517.0 |
| D | 7 | 3 | 4986 | 6.2 | 1950 | 1778 | 517.0 |
| D | 4 | 160 | 4951 | 6.14 | 1950 | 1778 | 517.0 |
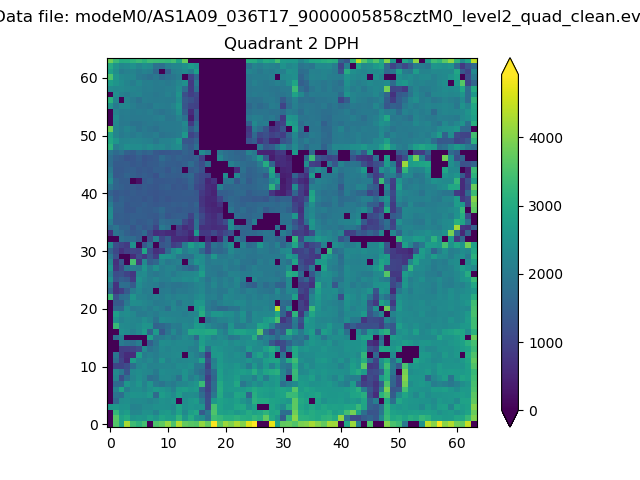
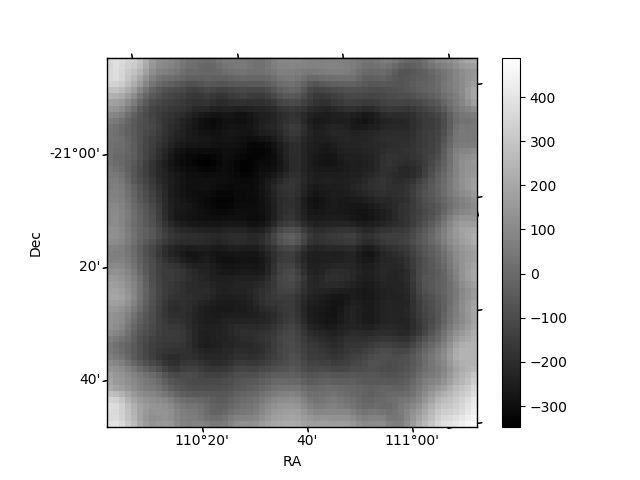
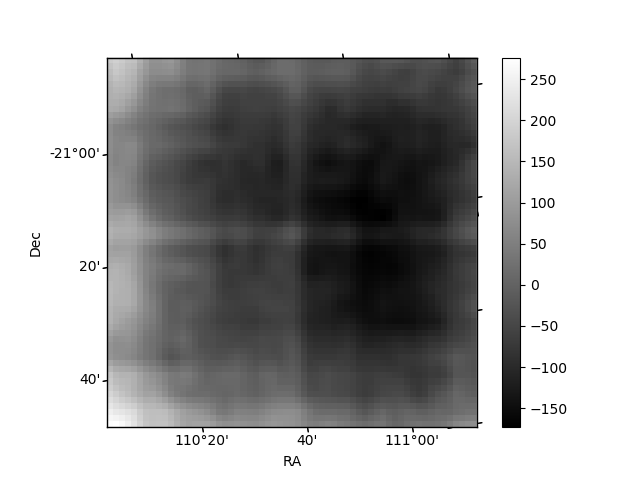
Histogram calculated using DETX and DETY for each event in the final _common_clean file
| Quadrant A |  |
 |
Quadrant B |
|---|---|---|---|
| Quadrant D |  |
 |
Quadrant C |
| Plot type | Count rate plots | Images |
|---|---|---|
| Comparison with Poisson distribution Blue bars denote a histogram of data divided into 1 sec bins. Red curve is a Poisson curve with rate = median count rate of data. |
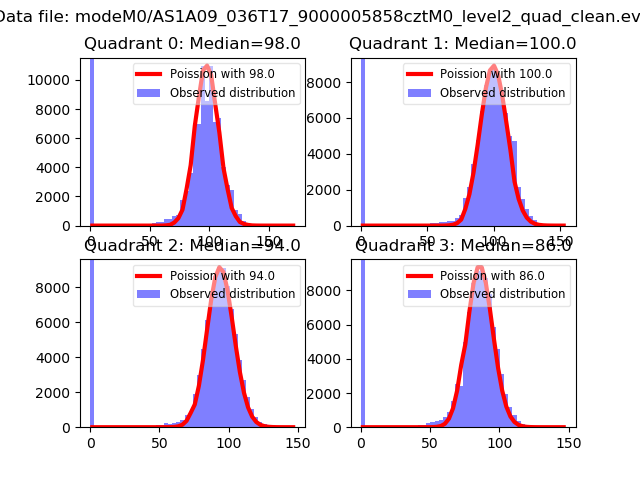 |
 |
| Quadrant-wise count rates Data is divided into 100 sec bins |
 |
|
| Module-wise count rates for Quadrant A Data is divided into 100 sec bins |
 |
 |
| Module-wise count rates for Quadrant B Data is divided into 100 sec bins |
 |
 |
| Module-wise count rates for Quadrant C Data is divided into 100 sec bins |
 |
 |
| Module-wise count rates for Quadrant D Data is divided into 100 sec bins |
 |
 |
| Parameter | Plot |
|---|---|
| CZT HV Monitor |  |
| D_VDD |  |
| Temperature 1 |  |
| Veto HV Monitor |  |
| Veto LLD |  |
| Alpha Counter |  |
| _CPM_Rate | 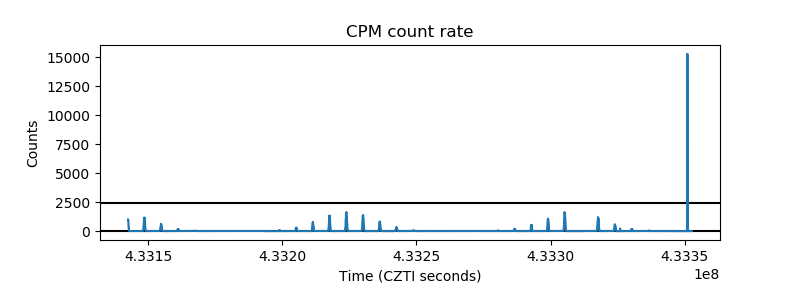 |
| CZT Counter |  |
| +2.5 Volts monitor |  |
| +5 Volts monitor |  |
| _ROLL_ROT |  |
| _Roll_DEC |  |
| _Roll_RA |  |
| Veto Counter |  |