| Param | Original file | Final file |
|---|---|---|
| Filename | modeM0/AS1A06_006T01_9000005860cztM0_level2.fits | modeM0/AS1A06_006T01_9000005860cztM0_level2_quad_clean.evt |
| Size (bytes) | 2,343,856,320 | 2,474,043,840 |
| Size | 2.2 GB | 2.3 GB |
| Events in quadrant A | 13,756,254 | 14,526,999 |
| Events in quadrant B | 13,473,514 | 15,271,275 |
| Events in quadrant C | 13,808,772 | 14,209,382 |
| Events in quadrant D | 11,674,240 | 12,659,246 |
| Mode SS | |||
|---|---|---|---|
| Quadrant | BADHDUFLAG | Total packets | Discarded packets |
| A | 0 | 5460 | 0 |
| B | 0 | 5460 | 0 |
| C | 0 | 5460 | 0 |
| D | 0 | 5460 | 0 |
| Mode M9 | |||
|---|---|---|---|
| Quadrant | BADHDUFLAG | Total packets | Discarded packets |
| A | 0 | 995 | 0 |
| B | 0 | 995 | 0 |
| C | 0 | 995 | 0 |
| D | 0 | 995 | 0 |
| Mode M0 | |||
|---|---|---|---|
| Quadrant | BADHDUFLAG | Total packets | Discarded packets |
| A | 0 | 642858 | 0 |
| B | 0 | 543470 | 0 |
| C | 0 | 564514 | 0 |
| D | 0 | 698636 | 0 |
| Quadrant | Total seconds | Saturated seconds | Saturation percentage |
|---|---|---|---|
| A | 266638 | 6791 | 2.546899% |
| B | 266638 | 734 | 0.275280% |
| C | 266638 | 1627 | 0.610191% |
| D | 266638 | 12687 | 4.758136% |
Noise dominated data is calculated using 1-second bins in cleaned event files. If a bin has >2000 counts, and if more than 50% of those come from <1% of pixels, then it is considered to be noise-dominated and hence unusable.
| Quadrant | # 1 sec bins | Bins with >0 counts | Bins with >2000 counts | High rate bins dominated by noise | Noise dominated (total time) | Noise dominated (detector-on time) | Marked lightcurve |
|---|---|---|---|---|---|---|---|
| A | 366547 | 266089 | 0 | 0 | 0.00% | 0.00% |  |
| B | 366547 | 266637 | 0 | 0 | 0.00% | 0.00% |  |
| C | 366547 | 266594 | 0 | 0 | 0.00% | 0.00% |  |
| D | 366547 | 265638 | 0 | 0 | 0.00% | 0.00% |  |
Top three noisy pixels from each quadrant. If the there are fewer than three noisy pixels in the level2.evt file, extra rows are filled as -1
| Pixel properties | Quadrant properties | ||||||
|---|---|---|---|---|---|---|---|
| Quadrant | DetID | PixID | Counts | Sigma | Mean | Median | Sigma |
| A | 0 | 29 | 11500 | 9.07 | 3588 | 3340 | 900.0 |
| A | 9 | 19 | 11464 | 9.03 | 3588 | 3340 | 900.0 |
| A | 7 | 110 | 11315 | 8.86 | 3588 | 3340 | 900.0 |
| B | 2 | 9 | 11879 | 12.25 | 3558 | 3379 | 694.0 |
| B | 3 | 80 | 9702 | 9.11 | 3558 | 3379 | 694.0 |
| B | 2 | 8 | 9533 | 8.87 | 3558 | 3379 | 694.0 |
| C | 1 | 81 | 11408 | 8.69 | 3648 | 3409 | 920.9 |
| C | 1 | 80 | 11123 | 8.38 | 3648 | 3409 | 920.9 |
| C | 3 | 203 | 10746 | 7.97 | 3648 | 3409 | 920.9 |
| D | 7 | 3 | 8570 | 6.27 | 3346 | 3049 | 880.6 |
| D | 4 | 160 | 8477 | 6.16 | 3346 | 3049 | 880.6 |
| D | 10 | 189 | 8473 | 6.16 | 3346 | 3049 | 880.6 |
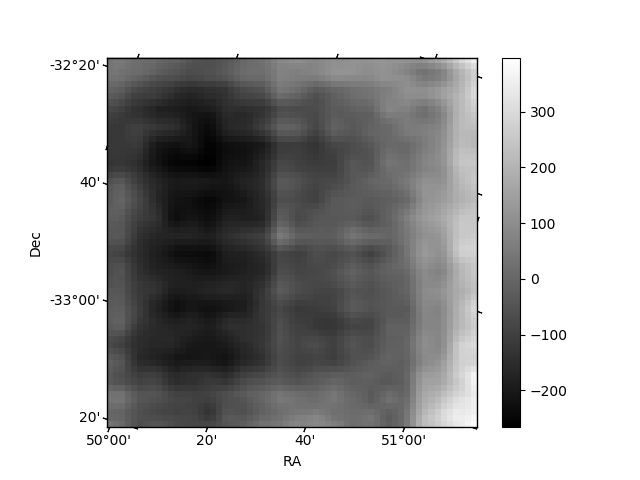
Histogram calculated using DETX and DETY for each event in the final _common_clean file
| Quadrant A | 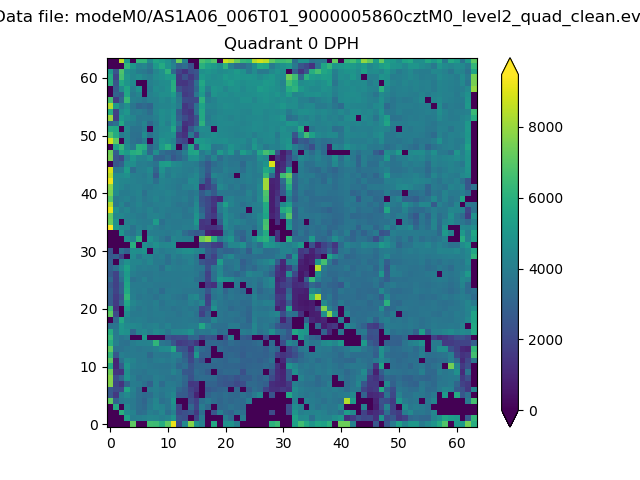 |
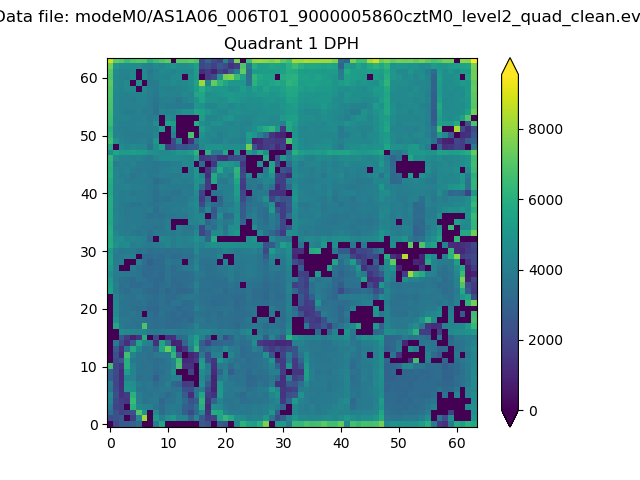 |
Quadrant B |
|---|---|---|---|
| Quadrant D | 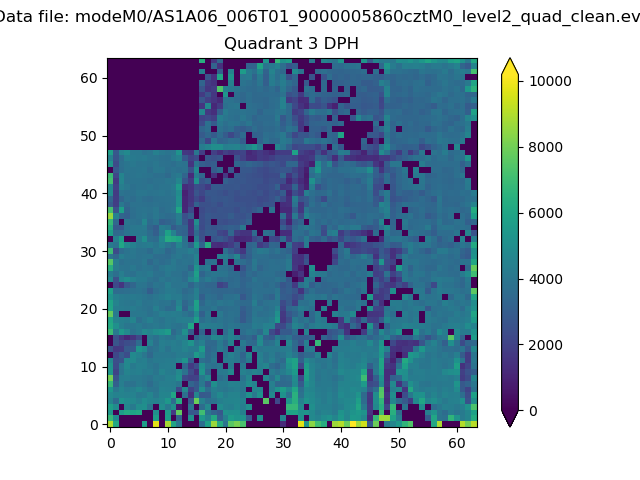 |
 |
Quadrant C |
| Plot type | Count rate plots | Images |
|---|---|---|
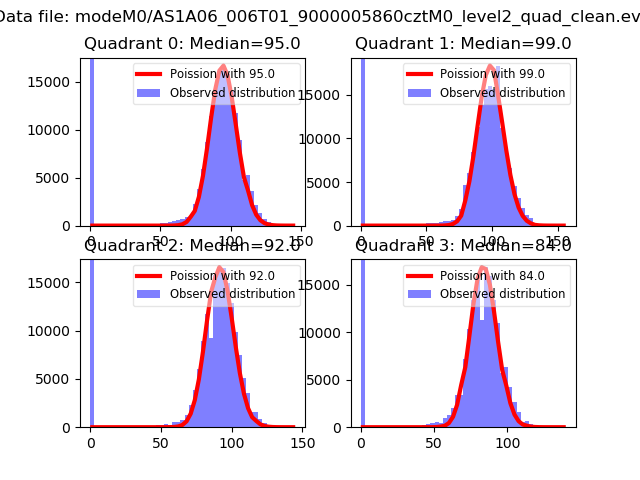
| Comparison with Poisson distribution Blue bars denote a histogram of data divided into 1 sec bins. Red curve is a Poisson curve with rate = median count rate of data. |
 |
 |
| Quadrant-wise count rates Data is divided into 100 sec bins |
 |
|
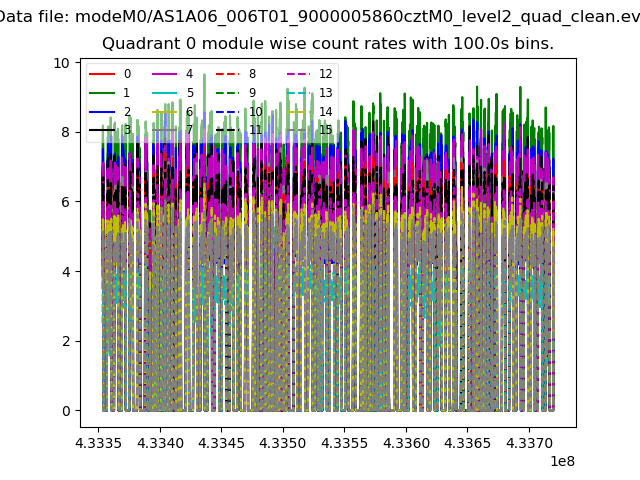
| Module-wise count rates for Quadrant A Data is divided into 100 sec bins |
 |
 |
| Module-wise count rates for Quadrant B Data is divided into 100 sec bins |
 |
 |
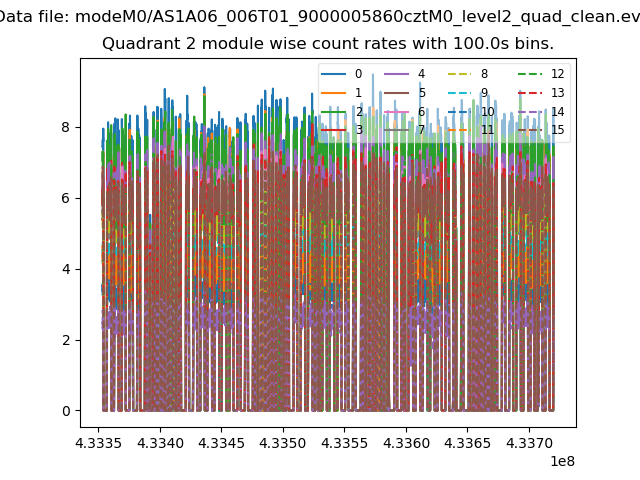
| Module-wise count rates for Quadrant C Data is divided into 100 sec bins |
 |
 |
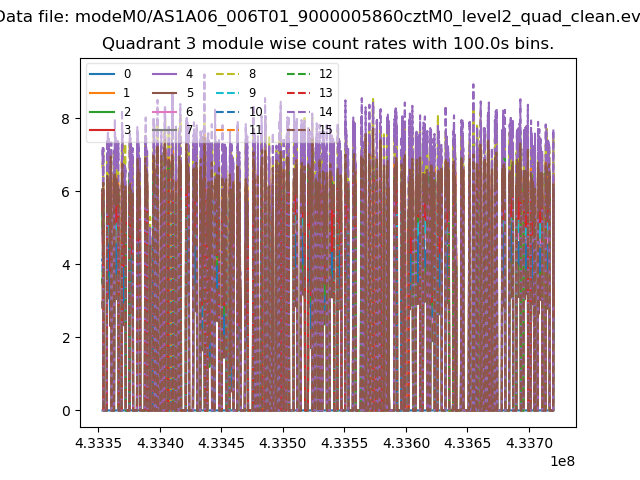
| Module-wise count rates for Quadrant D Data is divided into 100 sec bins |
 |
 |
| Parameter | Plot |
|---|---|
| CZT HV Monitor |  |
| D_VDD |  |
| Temperature 1 | 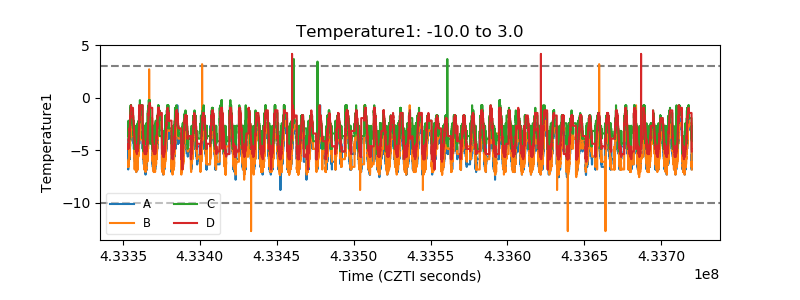 |
| Veto HV Monitor |  |
| Veto LLD |  |
| Alpha Counter |  |
| _CPM_Rate |  |
| CZT Counter | 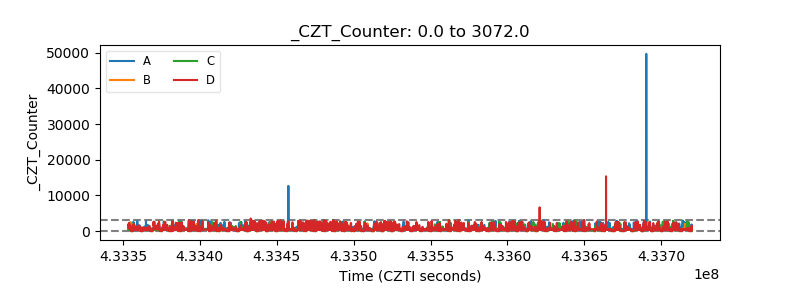 |
| +2.5 Volts monitor |  |
| +5 Volts monitor |  |
| _ROLL_ROT | 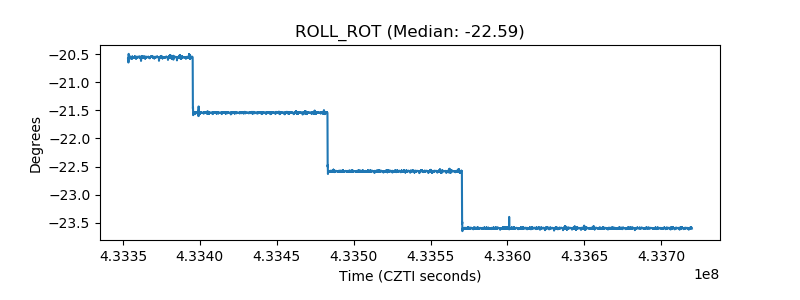 |
| _Roll_DEC |  |
| _Roll_RA | 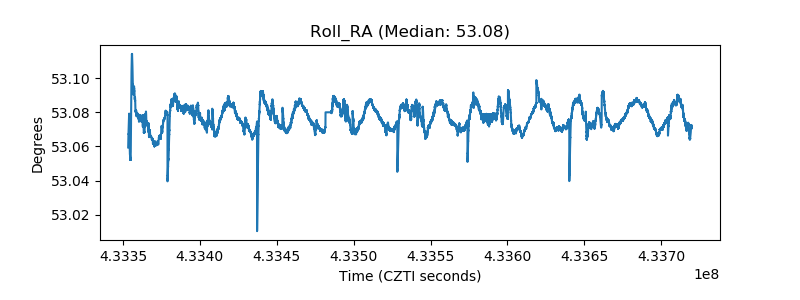 |
| Veto Counter |  |