| Param | Original file | Final file |
|---|---|---|
| Filename | modeM0/AS1A12_088T25_9000005866cztM0_level2.fits | modeM0/AS1A12_088T25_9000005866cztM0_level2_quad_clean.evt |
| Size (bytes) | 677,669,760 | 758,139,840 |
| Size | 646.3 MB | 723.0 MB |
| Events in quadrant A | 3,978,244 | 4,511,534 |
| Events in quadrant B | 3,920,008 | 4,723,740 |
| Events in quadrant C | 3,996,970 | 4,531,078 |
| Events in quadrant D | 3,433,044 | 4,001,794 |
| Mode SS | |||
|---|---|---|---|
| Quadrant | BADHDUFLAG | Total packets | Discarded packets |
| A | 0 | 1550 | 0 |
| B | 0 | 1550 | 0 |
| C | 0 | 1550 | 0 |
| D | 0 | 1550 | 0 |
| Mode M0 | |||
|---|---|---|---|
| Quadrant | BADHDUFLAG | Total packets | Discarded packets |
| A | 0 | 198191 | 0 |
| B | 0 | 162573 | 0 |
| C | 0 | 157125 | 0 |
| D | 0 | 186662 | 0 |
| Mode M9 | |||
|---|---|---|---|
| Quadrant | BADHDUFLAG | Total packets | Discarded packets |
| A | 0 | 286 | 0 |
| B | 0 | 286 | 0 |
| C | 0 | 286 | 0 |
| D | 0 | 286 | 0 |
| Quadrant | Total seconds | Saturated seconds | Saturation percentage |
|---|---|---|---|
| A | 75738 | 2806 | 3.704877% |
| B | 75738 | 495 | 0.653569% |
| C | 75738 | 183 | 0.241622% |
| D | 75738 | 2218 | 2.928517% |
Noise dominated data is calculated using 1-second bins in cleaned event files. If a bin has >2000 counts, and if more than 50% of those come from <1% of pixels, then it is considered to be noise-dominated and hence unusable.
| Quadrant | # 1 sec bins | Bins with >0 counts | Bins with >2000 counts | High rate bins dominated by noise | Noise dominated (total time) | Noise dominated (detector-on time) | Marked lightcurve |
|---|---|---|---|---|---|---|---|
| A | 104383 | 75467 | 0 | 0 | 0.00% | 0.00% |  |
| B | 104383 | 75734 | 0 | 0 | 0.00% | 0.00% |  |
| C | 104383 | 75737 | 0 | 0 | 0.00% | 0.00% | 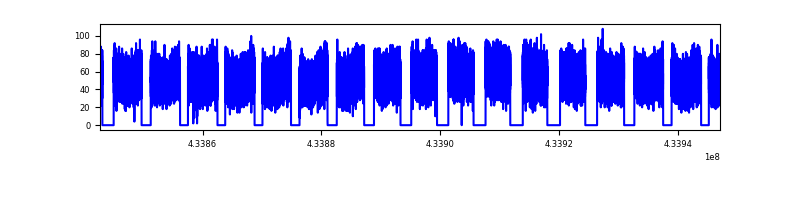 |
| D | 104383 | 75693 | 0 | 0 | 0.00% | 0.00% |  |
Top three noisy pixels from each quadrant. If the there are fewer than three noisy pixels in the level2.evt file, extra rows are filled as -1
| Pixel properties | Quadrant properties | ||||||
|---|---|---|---|---|---|---|---|
| Quadrant | DetID | PixID | Counts | Sigma | Mean | Median | Sigma |
| A | 9 | 19 | 3343 | 9.02 | 1039 | 968 | 263.4 |
| A | 7 | 110 | 3220 | 8.55 | 1039 | 968 | 263.4 |
| A | 0 | 29 | 3193 | 8.45 | 1039 | 968 | 263.4 |
| B | 2 | 9 | 3440 | 11.99 | 1034 | 983 | 204.8 |
| B | 5 | 232 | 2828 | 9.01 | 1034 | 983 | 204.8 |
| B | 2 | 8 | 2786 | 8.8 | 1034 | 983 | 204.8 |
| C | 1 | 81 | 3293 | 8.48 | 1057 | 989 | 271.7 |
| C | 3 | 202 | 3265 | 8.38 | 1057 | 989 | 271.7 |
| C | 3 | 203 | 3232 | 8.26 | 1057 | 989 | 271.7 |
| D | 10 | 189 | 2576 | 6.38 | 981 | 892 | 264.0 |
| D | 7 | 3 | 2555 | 6.3 | 981 | 892 | 264.0 |
| D | 10 | 113 | 2481 | 6.02 | 981 | 892 | 264.0 |
Histogram calculated using DETX and DETY for each event in the final _common_clean file
| Quadrant A | 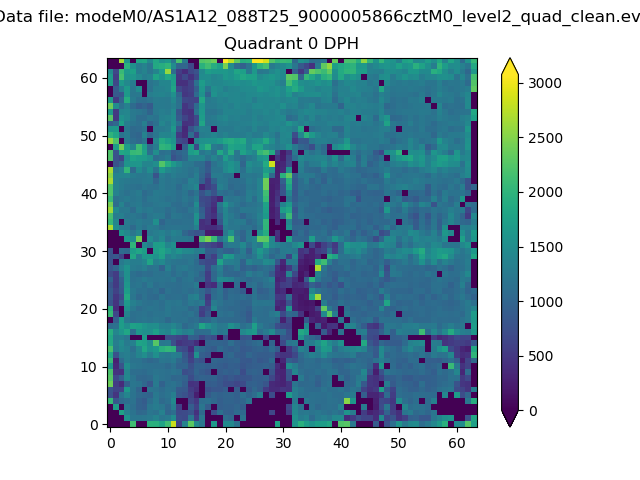 |
 |
Quadrant B |
|---|---|---|---|
| Quadrant D | 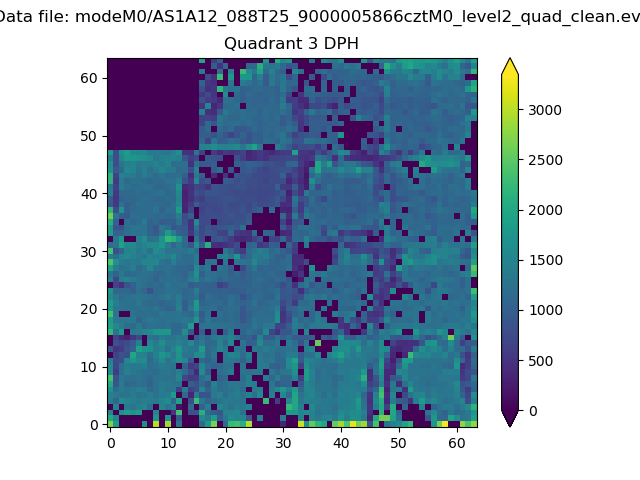 |
 |
Quadrant C |
| Plot type | Count rate plots | Images |
|---|---|---|
| Comparison with Poisson distribution Blue bars denote a histogram of data divided into 1 sec bins. Red curve is a Poisson curve with rate = median count rate of data. |
 |
 |
| Quadrant-wise count rates Data is divided into 100 sec bins |
 |
|
| Module-wise count rates for Quadrant A Data is divided into 100 sec bins |
 |
 |
| Module-wise count rates for Quadrant B Data is divided into 100 sec bins |
 |
 |
| Module-wise count rates for Quadrant C Data is divided into 100 sec bins |
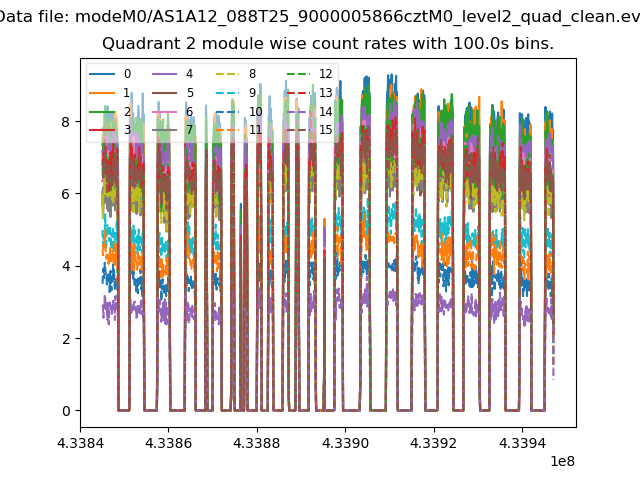 |
 |
| Module-wise count rates for Quadrant D Data is divided into 100 sec bins |
 |
 |
| Parameter | Plot |
|---|---|
| CZT HV Monitor |  |
| D_VDD | 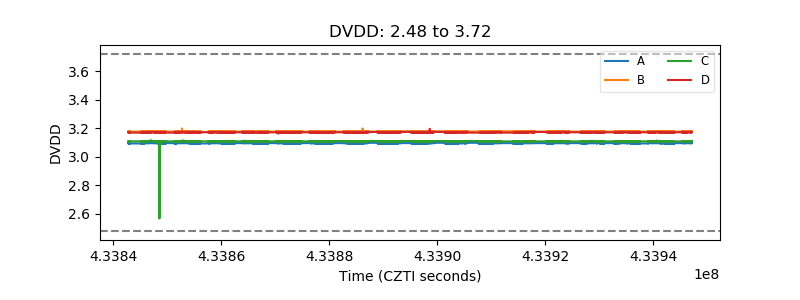 |
| Temperature 1 |  |
| Veto HV Monitor |  |
| Veto LLD |  |
| Alpha Counter | 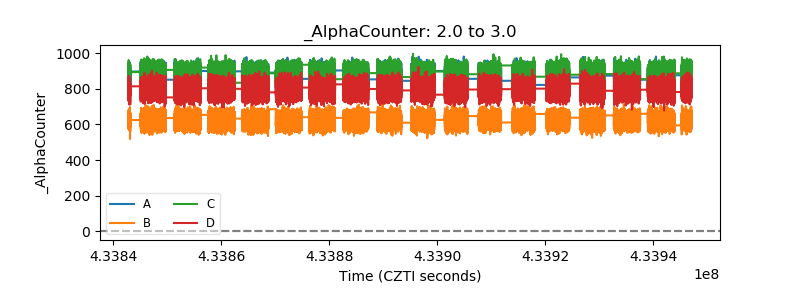 |
| _CPM_Rate | 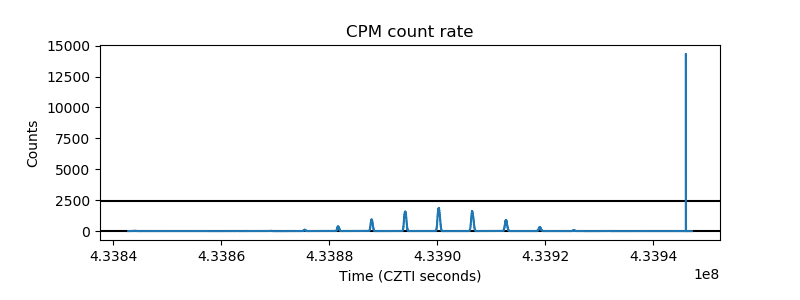 |
| CZT Counter |  |
| +2.5 Volts monitor | 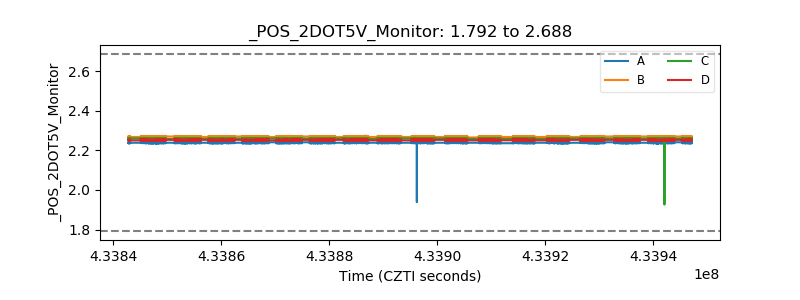 |
| +5 Volts monitor |  |
| _ROLL_ROT |  |
| _Roll_DEC |  |
| _Roll_RA |  |
| Veto Counter |  |