| Param | Original file | Final file |
|---|---|---|
| Filename | modeM0/AS1T05_158T01_9000005868cztM0_level2.fits | modeM0/AS1T05_158T01_9000005868cztM0_level2_quad_clean.evt |
| Size (bytes) | 1,190,799,360 | 1,246,654,080 |
| Size | 1.1 GB | 1.2 GB |
| Events in quadrant A | 7,046,904 | 7,487,767 |
| Events in quadrant B | 6,860,152 | 7,555,953 |
| Events in quadrant C | 7,015,146 | 7,128,607 |
| Events in quadrant D | 6,058,968 | 6,502,564 |
| Mode M0 | |||
|---|---|---|---|
| Quadrant | BADHDUFLAG | Total packets | Discarded packets |
| A | 0 | 299983 | 0 |
| B | 0 | 274652 | 0 |
| C | 0 | 271621 | 0 |
| D | 0 | 298103 | 0 |
| Mode M9 | |||
|---|---|---|---|
| Quadrant | BADHDUFLAG | Total packets | Discarded packets |
| A | 0 | 490 | 0 |
| B | 0 | 490 | 0 |
| C | 0 | 490 | 0 |
| D | 0 | 490 | 0 |
| Mode SS | |||
|---|---|---|---|
| Quadrant | BADHDUFLAG | Total packets | Discarded packets |
| A | 0 | 2708 | 0 |
| B | 0 | 2708 | 0 |
| C | 0 | 2708 | 0 |
| D | 0 | 2708 | 0 |
| Quadrant | Total seconds | Saturated seconds | Saturation percentage |
|---|---|---|---|
| A | 132553 | 1641 | 1.237995% |
| B | 132553 | 693 | 0.522810% |
| C | 132551 | 133 | 0.100339% |
| D | 132553 | 2031 | 1.532217% |
Noise dominated data is calculated using 1-second bins in cleaned event files. If a bin has >2000 counts, and if more than 50% of those come from <1% of pixels, then it is considered to be noise-dominated and hence unusable.
| Quadrant | # 1 sec bins | Bins with >0 counts | Bins with >2000 counts | High rate bins dominated by noise | Noise dominated (total time) | Noise dominated (detector-on time) | Marked lightcurve |
|---|---|---|---|---|---|---|---|
| A | 181566 | 132399 | 0 | 0 | 0.00% | 0.00% |  |
| B | 181566 | 132550 | 0 | 0 | 0.00% | 0.00% |  |
| C | 181566 | 132550 | 0 | 0 | 0.00% | 0.00% |  |
| D | 181566 | 132431 | 0 | 0 | 0.00% | 0.00% | 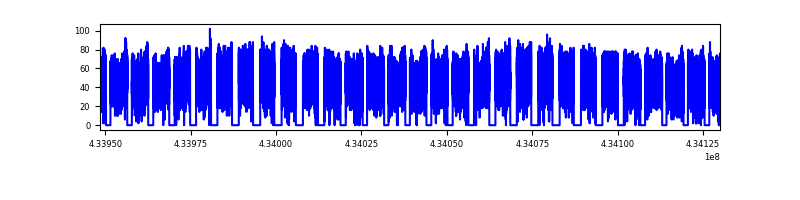 |
Top three noisy pixels from each quadrant. If the there are fewer than three noisy pixels in the level2.evt file, extra rows are filled as -1
| Pixel properties | Quadrant properties | ||||||
|---|---|---|---|---|---|---|---|
| Quadrant | DetID | PixID | Counts | Sigma | Mean | Median | Sigma |
| A | 7 | 110 | 5708 | 8.6 | 1842 | 1718 | 463.9 |
| A | 0 | 29 | 5699 | 8.58 | 1842 | 1718 | 463.9 |
| A | 9 | 19 | 5688 | 8.56 | 1842 | 1718 | 463.9 |
| B | 2 | 9 | 6027 | 12.16 | 1806 | 1711 | 355.0 |
| B | 3 | 17 | 4815 | 8.74 | 1806 | 1711 | 355.0 |
| B | 2 | 8 | 4757 | 8.58 | 1806 | 1711 | 355.0 |
| C | 1 | 81 | 5663 | 8.34 | 1853 | 1722 | 472.6 |
| C | 1 | 80 | 5434 | 7.85 | 1853 | 1722 | 472.6 |
| C | 3 | 203 | 5377 | 7.73 | 1853 | 1722 | 472.6 |
| D | 7 | 3 | 4398 | 6.17 | 1734 | 1576 | 457.5 |
| D | 10 | 189 | 4370 | 6.11 | 1734 | 1576 | 457.5 |
| D | 4 | 160 | 4364 | 6.09 | 1734 | 1576 | 457.5 |
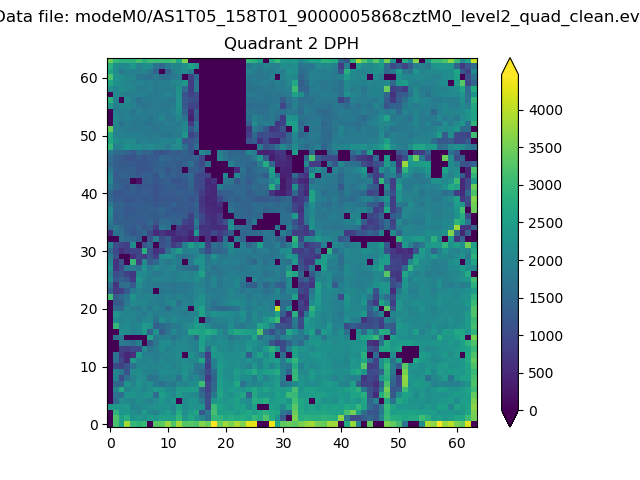
Histogram calculated using DETX and DETY for each event in the final _common_clean file
| Quadrant A |  |
 |
Quadrant B |
|---|---|---|---|
| Quadrant D |  |
 |
Quadrant C |
| Plot type | Count rate plots | Images |
|---|---|---|
| Comparison with Poisson distribution Blue bars denote a histogram of data divided into 1 sec bins. Red curve is a Poisson curve with rate = median count rate of data. |
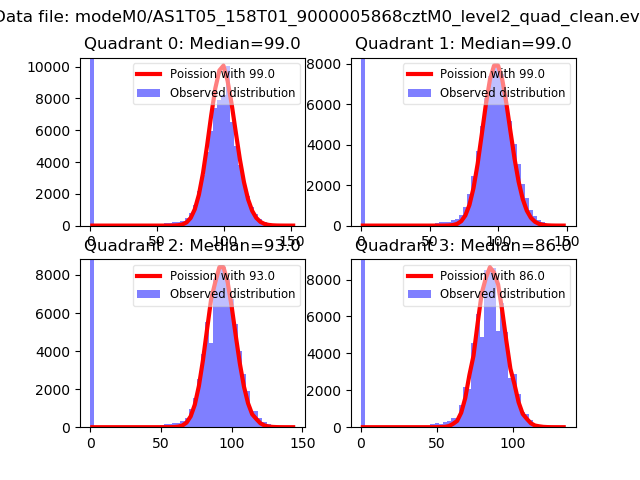 |
 |
| Quadrant-wise count rates Data is divided into 100 sec bins |
 |
|
| Module-wise count rates for Quadrant A Data is divided into 100 sec bins |
 |
 |
| Module-wise count rates for Quadrant B Data is divided into 100 sec bins |
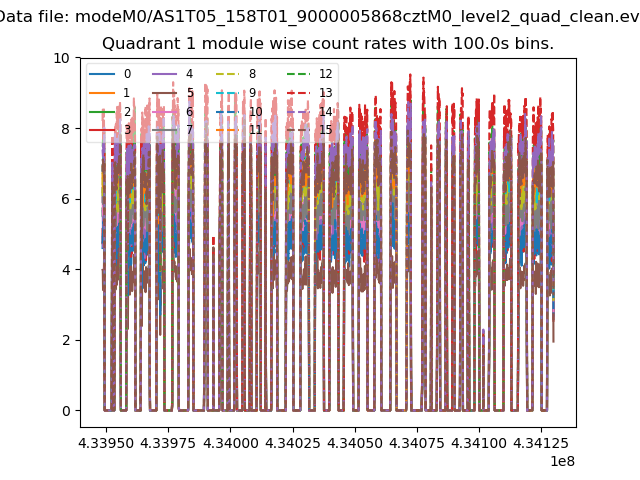 |
 |
| Module-wise count rates for Quadrant C Data is divided into 100 sec bins |
 |
 |
| Module-wise count rates for Quadrant D Data is divided into 100 sec bins |
 |
 |
| Parameter | Plot |
|---|---|
| CZT HV Monitor |  |
| D_VDD | 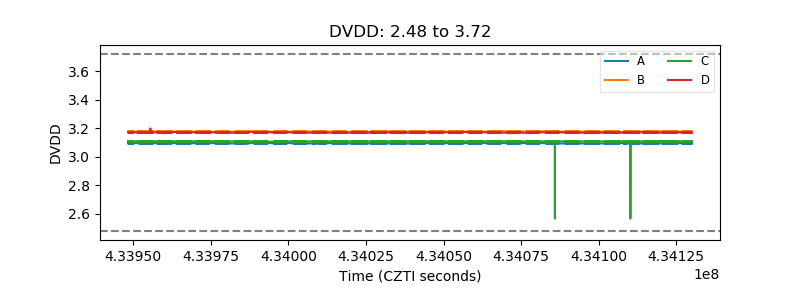 |
| Temperature 1 |  |
| Veto HV Monitor | 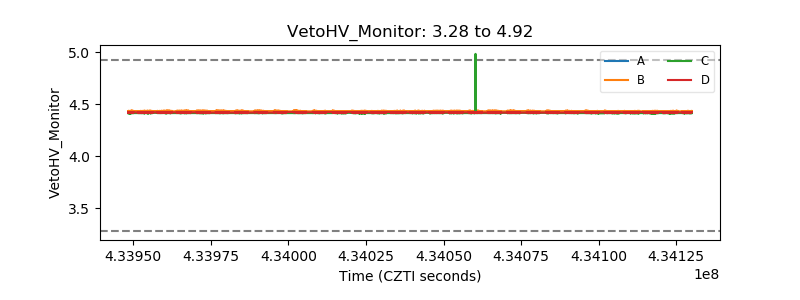 |
| Veto LLD |  |
| Alpha Counter |  |
| _CPM_Rate | 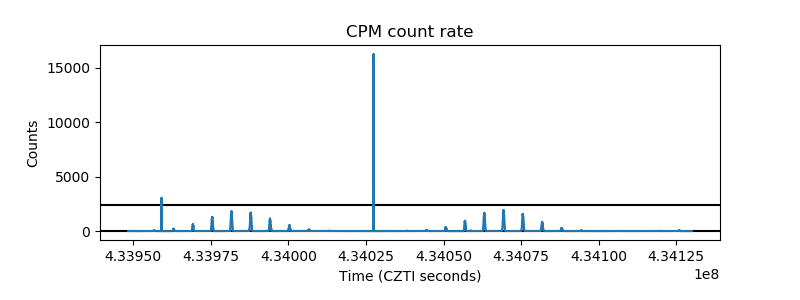 |
| CZT Counter |  |
| +2.5 Volts monitor |  |
| +5 Volts monitor | 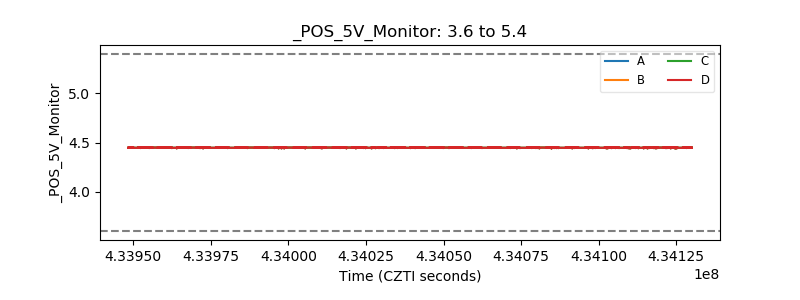 |
| _ROLL_ROT |  |
| _Roll_DEC |  |
| _Roll_RA | 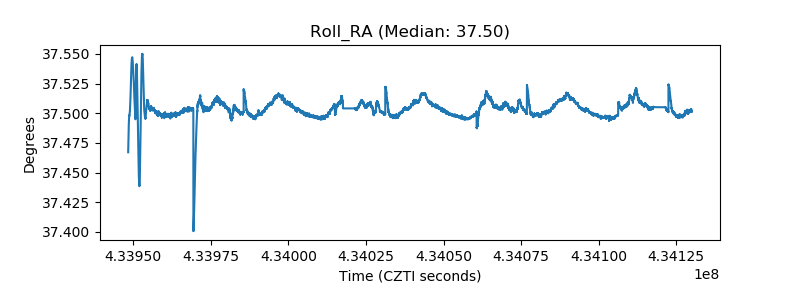 |
| Veto Counter |  |