| Param | Original file | Final file |
|---|---|---|
| Filename | modeM0/AS1A09_143T01_9000005870cztM0_level2.fits | modeM0/AS1A09_143T01_9000005870cztM0_level2_quad_clean.evt |
| Size (bytes) | 952,355,520 | 1,216,584,000 |
| Size | 908.2 MB | 1.1 GB |
| Events in quadrant A | 5,626,436 | 7,567,153 |
| Events in quadrant B | 5,459,136 | 7,746,783 |
| Events in quadrant C | 5,583,932 | 7,432,364 |
| Events in quadrant D | 4,764,660 | 6,696,716 |
| Mode SS | |||
|---|---|---|---|
| Quadrant | BADHDUFLAG | Total packets | Discarded packets |
| A | 0 | 2210 | 0 |
| B | 0 | 2210 | 0 |
| C | 0 | 2210 | 0 |
| D | 0 | 2210 | 0 |
| Mode M9 | |||
|---|---|---|---|
| Quadrant | BADHDUFLAG | Total packets | Discarded packets |
| A | 0 | 423 | 0 |
| B | 0 | 423 | 0 |
| C | 0 | 423 | 0 |
| D | 0 | 423 | 0 |
| Mode M0 | |||
|---|---|---|---|
| Quadrant | BADHDUFLAG | Total packets | Discarded packets |
| A | 0 | 251727 | 0 |
| B | 0 | 228012 | 0 |
| C | 0 | 229371 | 0 |
| D | 0 | 266765 | 0 |
| Quadrant | Total seconds | Saturated seconds | Saturation percentage |
|---|---|---|---|
| A | 108063 | 2009 | 1.859101% |
| B | 108063 | 568 | 0.525619% |
| C | 108061 | 313 | 0.289651% |
| D | 108063 | 3935 | 3.641394% |
Noise dominated data is calculated using 1-second bins in cleaned event files. If a bin has >2000 counts, and if more than 50% of those come from <1% of pixels, then it is considered to be noise-dominated and hence unusable.
| Quadrant | # 1 sec bins | Bins with >0 counts | Bins with >2000 counts | High rate bins dominated by noise | Noise dominated (total time) | Noise dominated (detector-on time) | Marked lightcurve |
|---|---|---|---|---|---|---|---|
| A | 150364 | 107955 | 0 | 0 | 0.00% | 0.00% |  |
| B | 150364 | 108053 | 0 | 0 | 0.00% | 0.00% |  |
| C | 150364 | 108057 | 0 | 0 | 0.00% | 0.00% |  |
| D | 150364 | 107871 | 0 | 0 | 0.00% | 0.00% |  |
Top three noisy pixels from each quadrant. If the there are fewer than three noisy pixels in the level2.evt file, extra rows are filled as -1
| Pixel properties | Quadrant properties | ||||||
|---|---|---|---|---|---|---|---|
| Quadrant | DetID | PixID | Counts | Sigma | Mean | Median | Sigma |
| A | 7 | 110 | 4653 | 8.76 | 1468 | 1375 | 374.0 |
| A | 9 | 19 | 4601 | 8.62 | 1468 | 1375 | 374.0 |
| A | 0 | 29 | 4588 | 8.59 | 1468 | 1375 | 374.0 |
| B | 2 | 9 | 4655 | 11.77 | 1441 | 1373 | 278.9 |
| B | 3 | 80 | 3885 | 9.01 | 1441 | 1373 | 278.9 |
| B | 5 | 128 | 3873 | 8.96 | 1441 | 1373 | 278.9 |
| C | 1 | 81 | 4611 | 8.58 | 1477 | 1384 | 376.2 |
| C | 1 | 80 | 4483 | 8.24 | 1477 | 1384 | 376.2 |
| C | 3 | 203 | 4308 | 7.77 | 1477 | 1384 | 376.2 |
| D | 7 | 3 | 3524 | 6.29 | 1362 | 1240 | 363.1 |
| D | 10 | 189 | 3509 | 6.25 | 1362 | 1240 | 363.1 |
| D | 4 | 160 | 3447 | 6.08 | 1362 | 1240 | 363.1 |
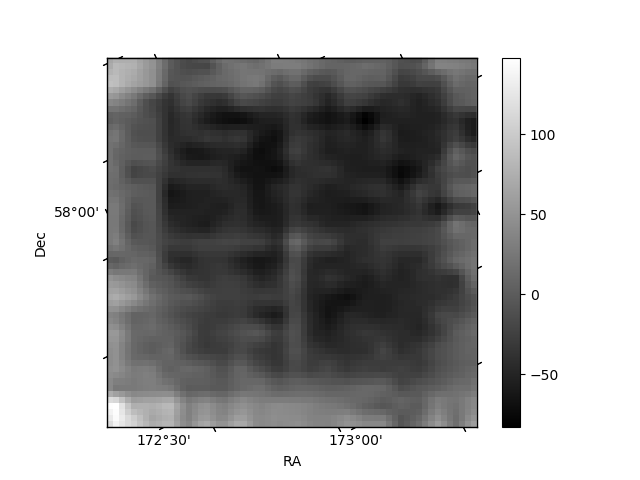
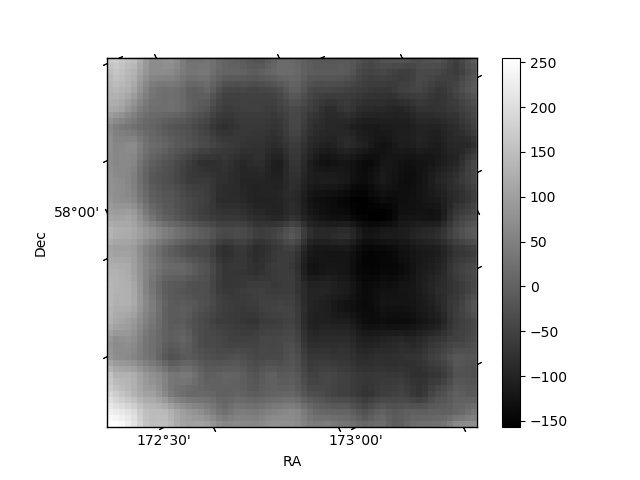
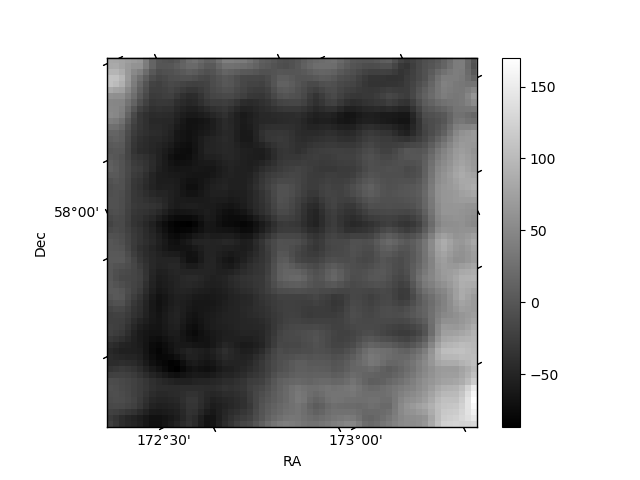
Histogram calculated using DETX and DETY for each event in the final _common_clean file
| Quadrant A |  |
 |
Quadrant B |
|---|---|---|---|
| Quadrant D |  |
 |
Quadrant C |
| Plot type | Count rate plots | Images |
|---|---|---|
| Comparison with Poisson distribution Blue bars denote a histogram of data divided into 1 sec bins. Red curve is a Poisson curve with rate = median count rate of data. |
 |
 |
| Quadrant-wise count rates Data is divided into 100 sec bins |
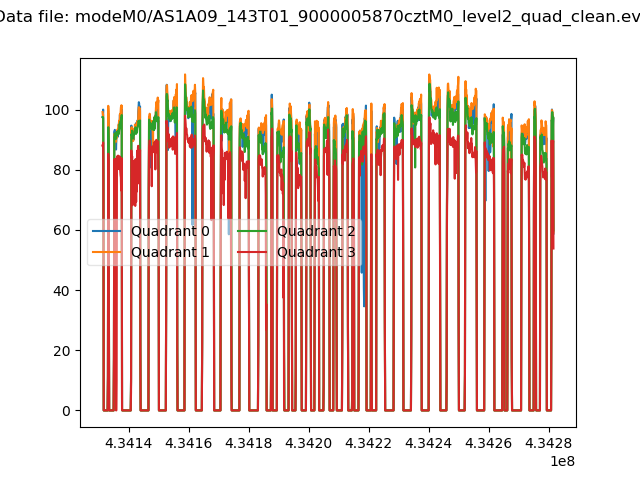 |
|
| Module-wise count rates for Quadrant A Data is divided into 100 sec bins |
 |
 |
| Module-wise count rates for Quadrant B Data is divided into 100 sec bins |
 |
 |
| Module-wise count rates for Quadrant C Data is divided into 100 sec bins |
 |
 |
| Module-wise count rates for Quadrant D Data is divided into 100 sec bins |
 |
 |
| Parameter | Plot |
|---|---|
| CZT HV Monitor |  |
| D_VDD | 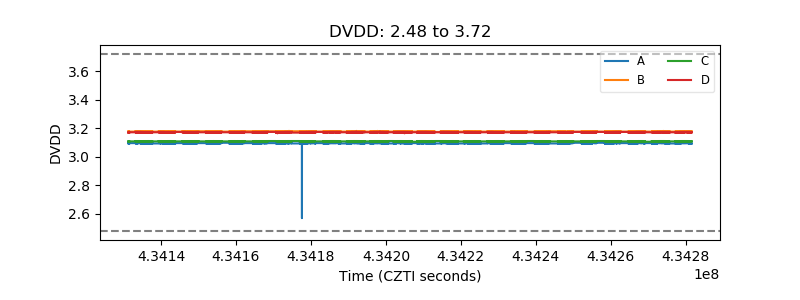 |
| Temperature 1 |  |
| Veto HV Monitor |  |
| Veto LLD |  |
| Alpha Counter |  |
| _CPM_Rate | 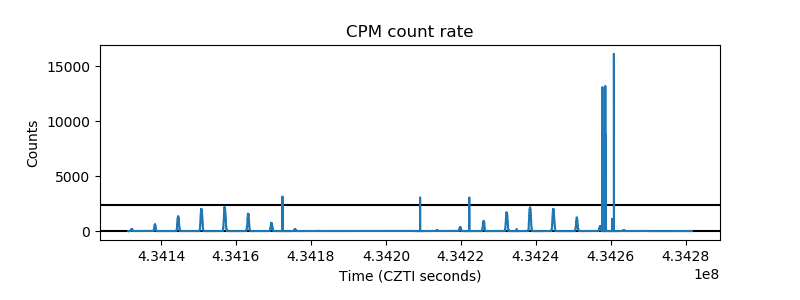 |
| CZT Counter |  |
| +2.5 Volts monitor |  |
| +5 Volts monitor |  |
| _ROLL_ROT |  |
| _Roll_DEC |  |
| _Roll_RA |  |
| Veto Counter |  |