| Param | Original file | Final file |
|---|---|---|
| Filename | modeM0/AS1A10_094T26_9000005882cztM0_level2.fits | modeM0/AS1A10_094T26_9000005882cztM0_level2_quad_clean.evt |
| Size (bytes) | 39,012,480 | 45,368,640 |
| Size | 37.2 MB | 43.3 MB |
| Events in quadrant A | 314,084 | 474,558 |
| Events in quadrant B | 299,450 | 468,184 |
| Events in quadrant C | 72,198 | 4,488 |
| Events in quadrant D | 66,816 | 2,918 |
| Mode SS | |||
|---|---|---|---|
| Quadrant | BADHDUFLAG | Total packets | Discarded packets |
| A | 0 | 124 | 0 |
| B | 0 | 124 | 0 |
| C | 0 | 124 | 0 |
| D | 0 | 124 | 0 |
| Mode M0 | |||
|---|---|---|---|
| Quadrant | BADHDUFLAG | Total packets | Discarded packets |
| A | 0 | 21434 | 0 |
| B | 0 | 25281 | 0 |
| C | 0 | 50313 | 0 |
| D | 0 | 37702 | 0 |
| Mode M9 | |||
|---|---|---|---|
| Quadrant | BADHDUFLAG | Total packets | Discarded packets |
| A | 0 | 10 | 0 |
| B | 0 | 10 | 0 |
| C | 0 | 10 | 0 |
| D | 0 | 10 | 0 |
| Quadrant | Total seconds | Saturated seconds | Saturation percentage |
|---|---|---|---|
| A | 6047 | 458 | 7.574004% |
| B | 6048 | 809 | 13.376323% |
| C | 6048 | 5989 | 99.024471% |
| D | 6048 | 6023 | 99.586640% |
Noise dominated data is calculated using 1-second bins in cleaned event files. If a bin has >2000 counts, and if more than 50% of those come from <1% of pixels, then it is considered to be noise-dominated and hence unusable.
| Quadrant | # 1 sec bins | Bins with >0 counts | Bins with >2000 counts | High rate bins dominated by noise | Noise dominated (total time) | Noise dominated (detector-on time) | Marked lightcurve |
|---|---|---|---|---|---|---|---|
| A | 7112 | 6045 | 0 | 0 | 0.00% | 0.00% |  |
| B | 7113 | 6048 | 0 | 0 | 0.00% | 0.00% |  |
| C | 7112 | 5640 | 0 | 0 | 0.00% | 0.00% |  |
| D | 7112 | 5357 | 0 | 0 | 0.00% | 0.00% |  |
Top three noisy pixels from each quadrant. If the there are fewer than three noisy pixels in the level2.evt file, extra rows are filled as -1
| Pixel properties | Quadrant properties | ||||||
|---|---|---|---|---|---|---|---|
| Quadrant | DetID | PixID | Counts | Sigma | Mean | Median | Sigma |
| A | 7 | 110 | 272 | 8.81 | 82 | 78 | 22.0 |
| A | 0 | 30 | 268 | 8.63 | 82 | 78 | 22.0 |
| A | 0 | 29 | 266 | 8.54 | 82 | 78 | 22.0 |
| B | 2 | 9 | 247 | 9.71 | 79 | 77 | 17.5 |
| B | 14 | 254 | 208 | 7.49 | 79 | 77 | 17.5 |
| B | 5 | 232 | 205 | 7.31 | 79 | 77 | 17.5 |
| C | 3 | 203 | 62 | 6.73 | 19 | 18 | 6.5 |
| C | 1 | 81 | 56 | 5.81 | 19 | 18 | 6.5 |
| C | 12 | 242 | 55 | 5.66 | 19 | 18 | 6.5 |
| D | 6 | 83 | 58 | 5.83 | 19 | 17 | 7.0 |
| D | 12 | 5 | 56 | 5.55 | 19 | 17 | 7.0 |
| D | 12 | 6 | 54 | 5.26 | 19 | 17 | 7.0 |
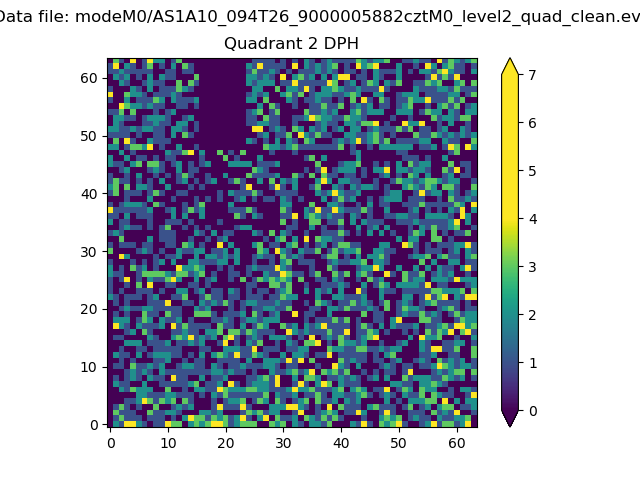
Histogram calculated using DETX and DETY for each event in the final _common_clean file
| Quadrant A |  |
 |
Quadrant B |
|---|---|---|---|
| Quadrant D | 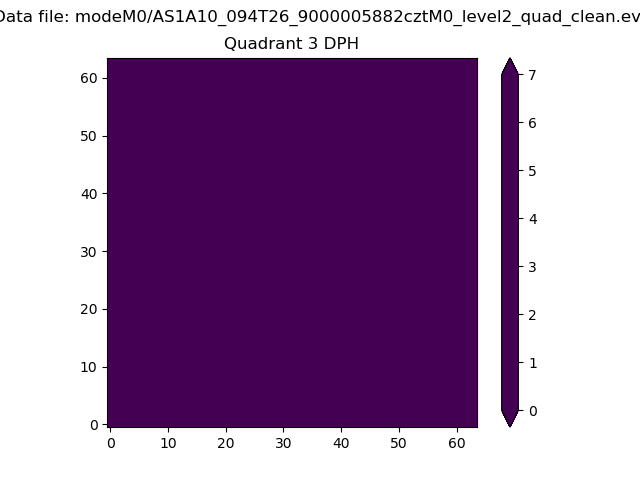 |
 |
Quadrant C |
| Plot type | Count rate plots | Images |
|---|---|---|
| Comparison with Poisson distribution Blue bars denote a histogram of data divided into 1 sec bins. Red curve is a Poisson curve with rate = median count rate of data. |
 |
 |
| Quadrant-wise count rates Data is divided into 100 sec bins |
 |
|
| Module-wise count rates for Quadrant A Data is divided into 100 sec bins |
 |
 |
| Module-wise count rates for Quadrant B Data is divided into 100 sec bins |
 |
 |
| Module-wise count rates for Quadrant C Data is divided into 100 sec bins |
 |
 |
| Module-wise count rates for Quadrant D Data is divided into 100 sec bins |
 |
 |
| Parameter | Plot |
|---|---|
| CZT HV Monitor |  |
| D_VDD | 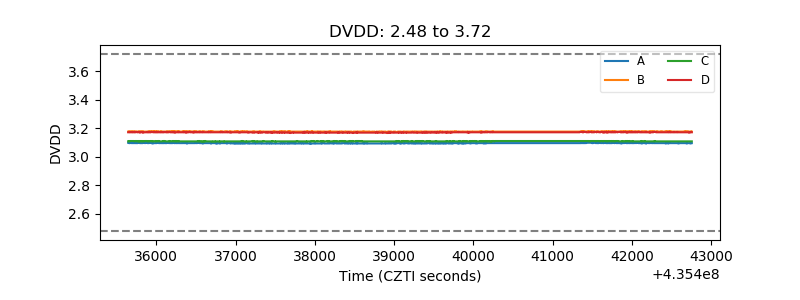 |
| Temperature 1 |  |
| Veto HV Monitor |  |
| Veto LLD |  |
| Alpha Counter |  |
| _CPM_Rate |  |
| CZT Counter |  |
| +2.5 Volts monitor |  |
| +5 Volts monitor |  |
| _ROLL_ROT |  |
| _Roll_DEC |  |
| _Roll_RA | 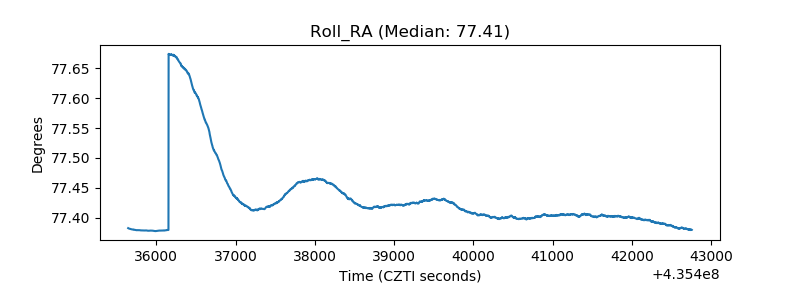 |
| Veto Counter |  |