| Param | Original file | Final file |
|---|---|---|
| Filename | modeM0/AS1C07_001T10_9000005890cztM0_level2.fits | modeM0/AS1C07_001T10_9000005890cztM0_level2_quad_clean.evt |
| Size (bytes) | 529,237,440 | 670,996,800 |
| Size | 504.7 MB | 639.9 MB |
| Events in quadrant A | 4,432,756 | 7,427,008 |
| Events in quadrant B | 4,030,016 | 6,587,100 |
| Events in quadrant C | 750,068 | 74,728 |
| Events in quadrant D | 732,226 | 239,965 |
| Mode SS | |||
|---|---|---|---|
| Quadrant | BADHDUFLAG | Total packets | Discarded packets |
| A | 0 | 1770 | 0 |
| B | 0 | 1770 | 0 |
| C | 0 | 1770 | 0 |
| D | 0 | 1770 | 0 |
| Mode M9 | |||
|---|---|---|---|
| Quadrant | BADHDUFLAG | Total packets | Discarded packets |
| A | 0 | 92 | 0 |
| B | 0 | 92 | 0 |
| C | 0 | 92 | 0 |
| D | 0 | 92 | 0 |
| Mode M0 | |||
|---|---|---|---|
| Quadrant | BADHDUFLAG | Total packets | Discarded packets |
| A | 0 | 267292 | 0 |
| B | 0 | 346527 | 0 |
| C | 0 | 726924 | 0 |
| D | 0 | 663620 | 0 |
| Quadrant | Total seconds | Saturated seconds | Saturation percentage |
|---|---|---|---|
| A | 87355 | 5044 | 5.774140% |
| B | 87357 | 15302 | 17.516627% |
| C | 87346 | 86379 | 98.892909% |
| D | 87351 | 84781 | 97.057847% |
Noise dominated data is calculated using 1-second bins in cleaned event files. If a bin has >2000 counts, and if more than 50% of those come from <1% of pixels, then it is considered to be noise-dominated and hence unusable.
| Quadrant | # 1 sec bins | Bins with >0 counts | Bins with >2000 counts | High rate bins dominated by noise | Noise dominated (total time) | Noise dominated (detector-on time) | Marked lightcurve |
|---|---|---|---|---|---|---|---|
| A | 97258 | 87352 | 0 | 0 | 0.00% | 0.00% | 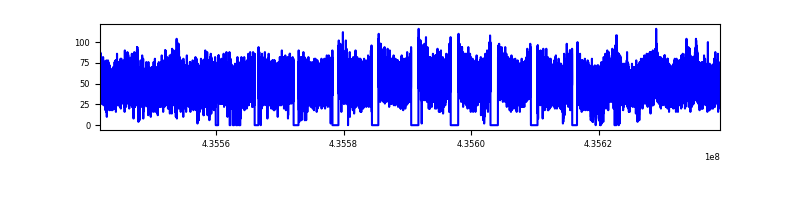 |
| B | 97258 | 87306 | 0 | 0 | 0.00% | 0.00% | 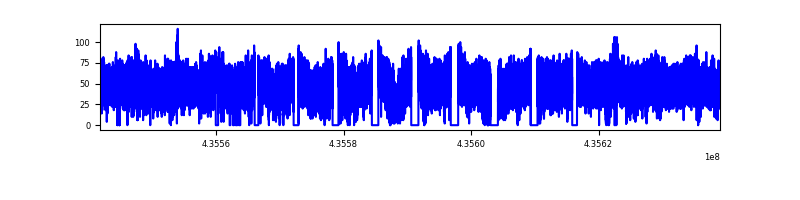 |
| C | 97255 | 71109 | 0 | 0 | 0.00% | 0.00% | 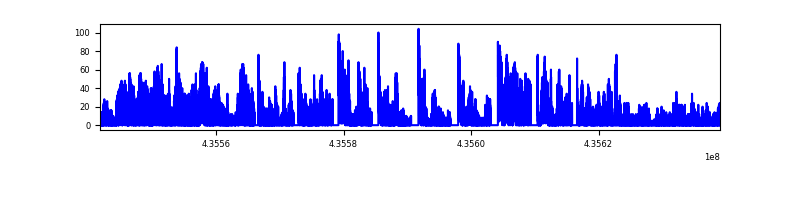 |
| D | 97258 | 68269 | 0 | 0 | 0.00% | 0.00% | 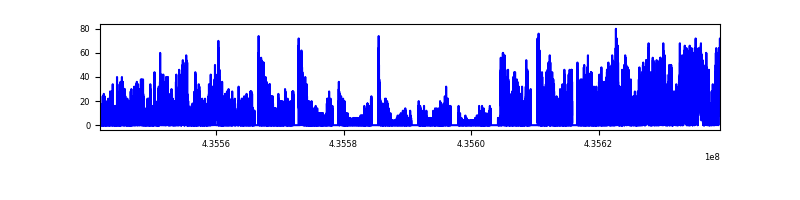 |
Top three noisy pixels from each quadrant. If the there are fewer than three noisy pixels in the level2.evt file, extra rows are filled as -1
| Pixel properties | Quadrant properties | ||||||
|---|---|---|---|---|---|---|---|
| Quadrant | DetID | PixID | Counts | Sigma | Mean | Median | Sigma |
| A | 0 | 29 | 3761 | 9.31 | 1163 | 1095 | 286.2 |
| A | 7 | 110 | 3715 | 9.15 | 1163 | 1095 | 286.2 |
| A | 0 | 30 | 3568 | 8.64 | 1163 | 1095 | 286.2 |
| B | 2 | 9 | 3663 | 12.67 | 1071 | 1024 | 208.3 |
| B | 3 | 17 | 2895 | 8.98 | 1071 | 1024 | 208.3 |
| B | 2 | 8 | 2839 | 8.71 | 1071 | 1024 | 208.3 |
| C | 1 | 81 | 661 | 9.27 | 199 | 186 | 51.3 |
| C | 1 | 80 | 636 | 8.78 | 199 | 186 | 51.3 |
| C | 3 | 202 | 581 | 7.71 | 199 | 186 | 51.3 |
| D | 6 | 38 | 565 | 6.03 | 214 | 191 | 62.1 |
| D | 10 | 189 | 561 | 5.96 | 214 | 191 | 62.1 |
| D | 15 | 46 | 554 | 5.85 | 214 | 191 | 62.1 |
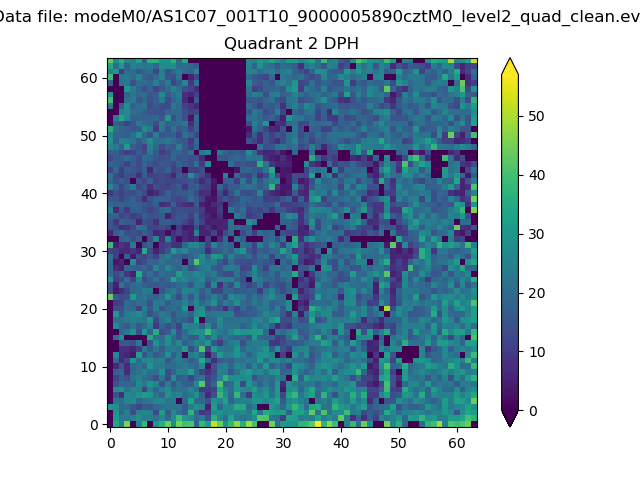
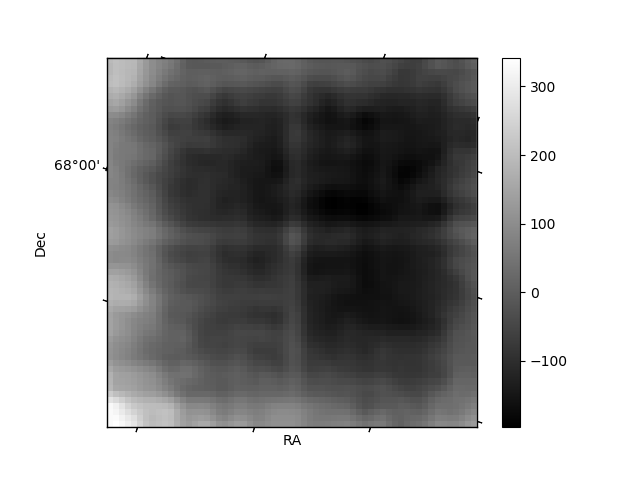
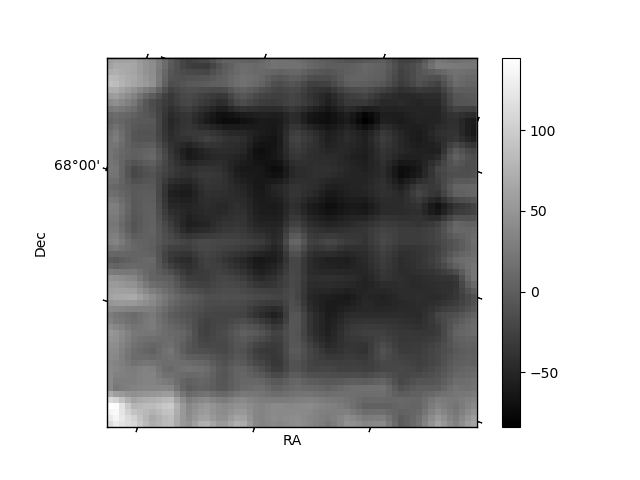
Histogram calculated using DETX and DETY for each event in the final _common_clean file
| Quadrant A | 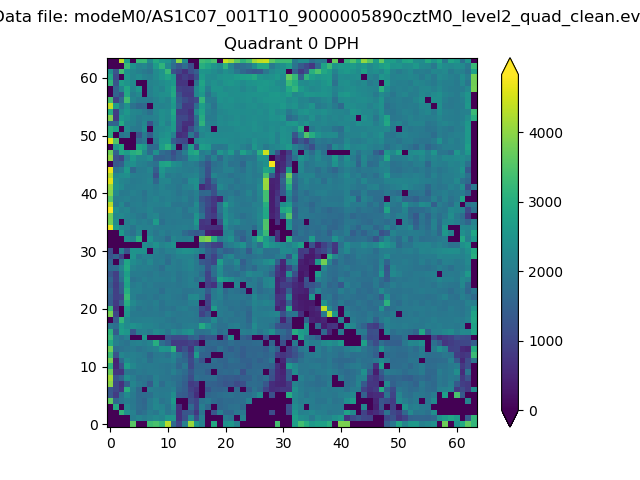 |
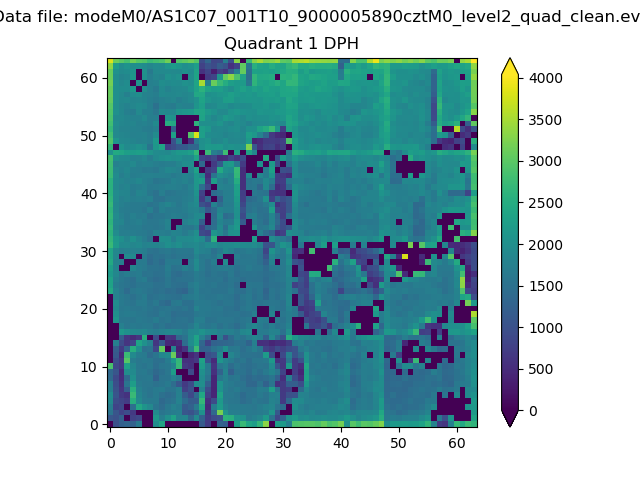 |
Quadrant B |
|---|---|---|---|
| Quadrant D | 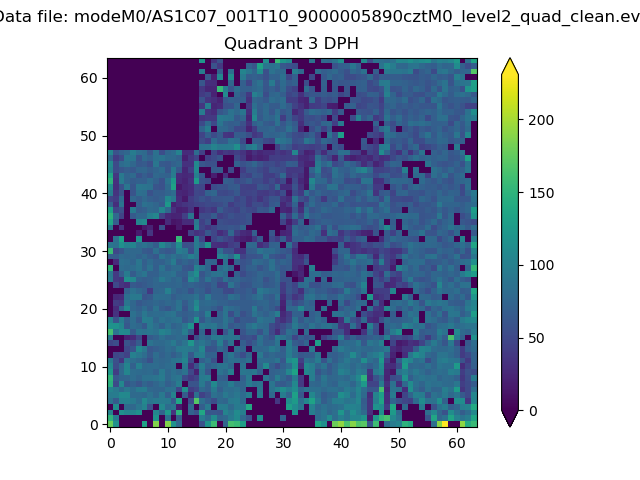 |
 |
Quadrant C |
| Plot type | Count rate plots | Images |
|---|---|---|
| Comparison with Poisson distribution Blue bars denote a histogram of data divided into 1 sec bins. Red curve is a Poisson curve with rate = median count rate of data. |
 |
 |
| Quadrant-wise count rates Data is divided into 100 sec bins |
 |
|
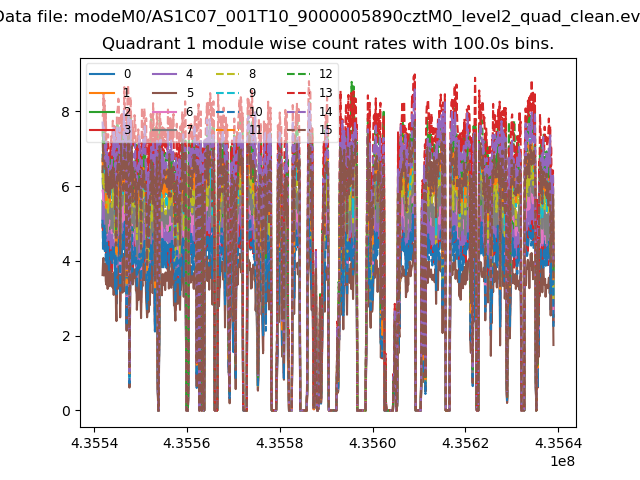
| Module-wise count rates for Quadrant A Data is divided into 100 sec bins |
 |
 |
| Module-wise count rates for Quadrant B Data is divided into 100 sec bins |
 |
 |
| Module-wise count rates for Quadrant C Data is divided into 100 sec bins |
 |
 |
| Module-wise count rates for Quadrant D Data is divided into 100 sec bins |
 |
 |
| Parameter | Plot |
|---|---|
| CZT HV Monitor |  |
| D_VDD |  |
| Temperature 1 |  |
| Veto HV Monitor |  |
| Veto LLD | 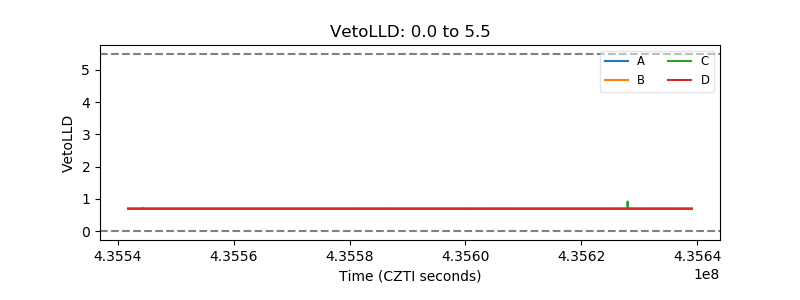 |
| Alpha Counter |  |
| _CPM_Rate | 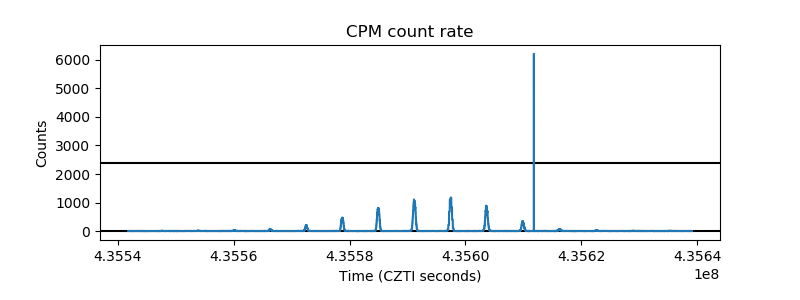 |
| CZT Counter |  |
| +2.5 Volts monitor | 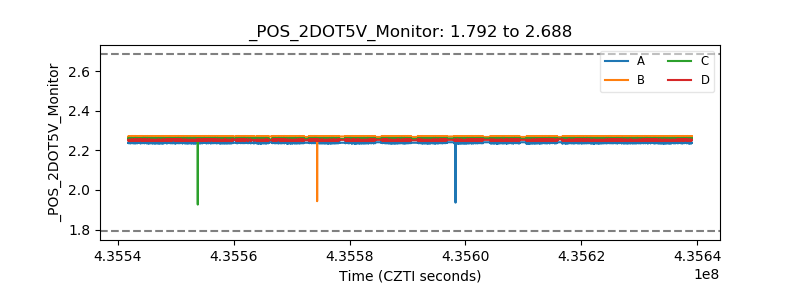 |
| +5 Volts monitor |  |
| _ROLL_ROT | 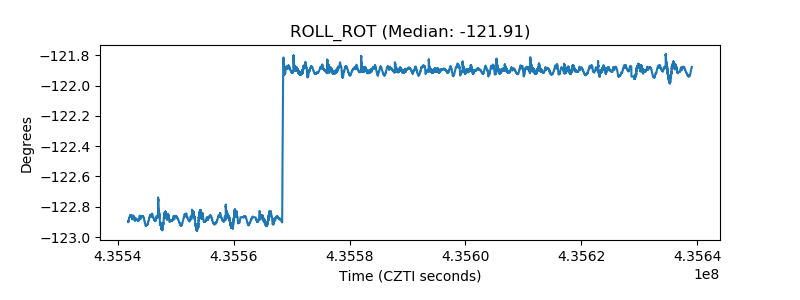 |
| _Roll_DEC |  |
| _Roll_RA | 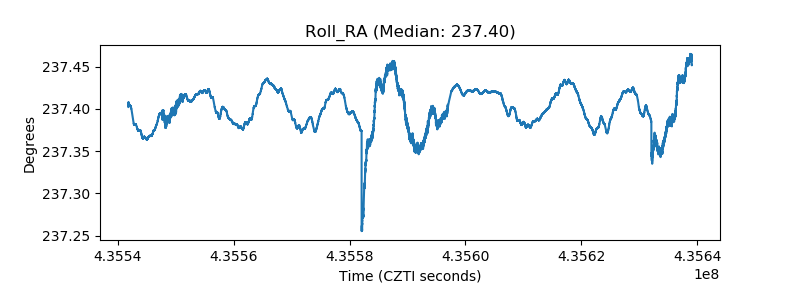 |
| Veto Counter |  |