| Param | Original file | Final file |
|---|---|---|
| Filename | modeM0/AS1A12_095T02_9000005892cztM0_level2.fits | modeM0/AS1A12_095T02_9000005892cztM0_level2_quad_clean.evt |
| Size (bytes) | 720,270,720 | 647,879,040 |
| Size | 686.9 MB | 617.9 MB |
| Events in quadrant A | 5,066,898 | 4,764,752 |
| Events in quadrant B | 4,940,724 | 4,802,060 |
| Events in quadrant C | 2,081,410 | 907,938 |
| Events in quadrant D | 2,962,648 | 2,444,859 |
| Mode M9 | |||
|---|---|---|---|
| Quadrant | BADHDUFLAG | Total packets | Discarded packets |
| A | 0 | 144 | 0 |
| B | 0 | 144 | 0 |
| C | 0 | 144 | 0 |
| D | 0 | 144 | 0 |
| Mode M0 | |||
|---|---|---|---|
| Quadrant | BADHDUFLAG | Total packets | Discarded packets |
| A | 0 | 303836 | 0 |
| B | 0 | 285477 | 0 |
| C | 0 | 746852 | 0 |
| D | 0 | 605521 | 0 |
| Mode SS | |||
|---|---|---|---|
| Quadrant | BADHDUFLAG | Total packets | Discarded packets |
| A | 0 | 1996 | 0 |
| B | 0 | 1998 | 0 |
| C | 0 | 1998 | 0 |
| D | 0 | 1994 | 0 |
| Quadrant | Total seconds | Saturated seconds | Saturation percentage |
|---|---|---|---|
| A | 97583 | 7778 | 7.970651% |
| B | 97547 | 6866 | 7.038658% |
| C | 97467 | 82907 | 85.061611% |
| D | 97502 | 56775 | 58.229575% |
Noise dominated data is calculated using 1-second bins in cleaned event files. If a bin has >2000 counts, and if more than 50% of those come from <1% of pixels, then it is considered to be noise-dominated and hence unusable.
| Quadrant | # 1 sec bins | Bins with >0 counts | Bins with >2000 counts | High rate bins dominated by noise | Noise dominated (total time) | Noise dominated (detector-on time) | Marked lightcurve |
|---|---|---|---|---|---|---|---|
| A | 122684 | 97591 | 0 | 0 | 0.00% | 0.00% |  |
| B | 122684 | 97560 | 0 | 0 | 0.00% | 0.00% | 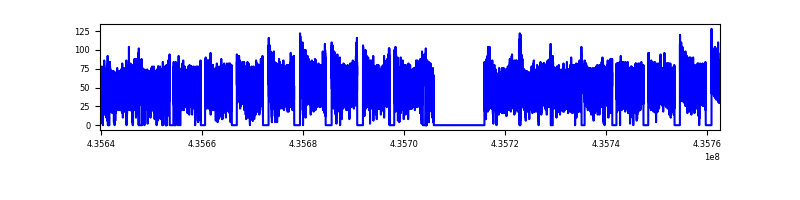 |
| C | 122683 | 90116 | 0 | 0 | 0.00% | 0.00% |  |
| D | 122683 | 94639 | 0 | 0 | 0.00% | 0.00% |  |
Top three noisy pixels from each quadrant. If the there are fewer than three noisy pixels in the level2.evt file, extra rows are filled as -1
| Pixel properties | Quadrant properties | ||||||
|---|---|---|---|---|---|---|---|
| Quadrant | DetID | PixID | Counts | Sigma | Mean | Median | Sigma |
| A | 0 | 29 | 4323 | 9.47 | 1327 | 1242 | 325.2 |
| A | 0 | 30 | 4203 | 9.1 | 1327 | 1242 | 325.2 |
| A | 7 | 110 | 4132 | 8.89 | 1327 | 1242 | 325.2 |
| B | 2 | 9 | 4420 | 12.37 | 1312 | 1249 | 256.4 |
| B | 3 | 17 | 3706 | 9.58 | 1312 | 1249 | 256.4 |
| B | 2 | 8 | 3420 | 8.47 | 1312 | 1249 | 256.4 |
| C | 3 | 202 | 1661 | 8.26 | 552 | 515 | 138.8 |
| C | 1 | 81 | 1611 | 7.9 | 552 | 515 | 138.8 |
| C | 1 | 80 | 1581 | 7.68 | 552 | 515 | 138.8 |
| D | 15 | 46 | 2343 | 6.55 | 865 | 783 | 238.3 |
| D | 10 | 189 | 2319 | 6.44 | 865 | 783 | 238.3 |
| D | 6 | 38 | 2238 | 6.11 | 865 | 783 | 238.3 |
Histogram calculated using DETX and DETY for each event in the final _common_clean file
| Quadrant A | 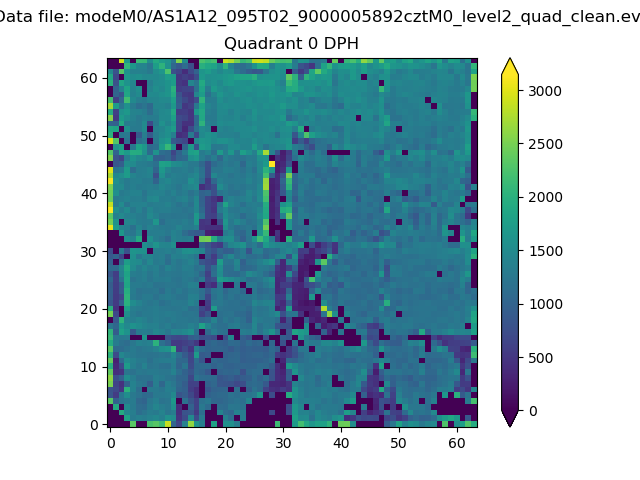 |
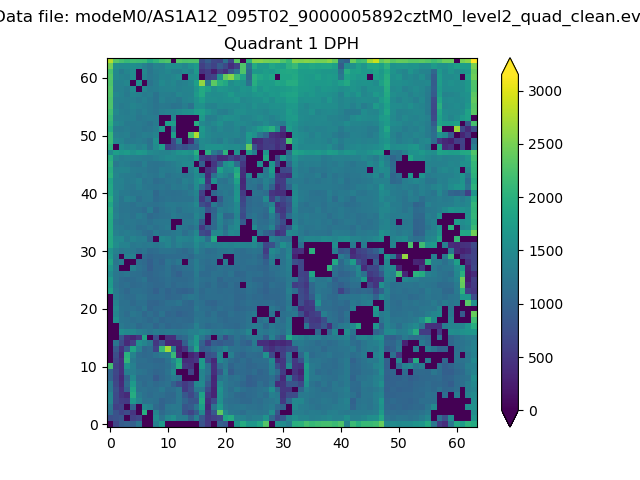 |
Quadrant B |
|---|---|---|---|
| Quadrant D | 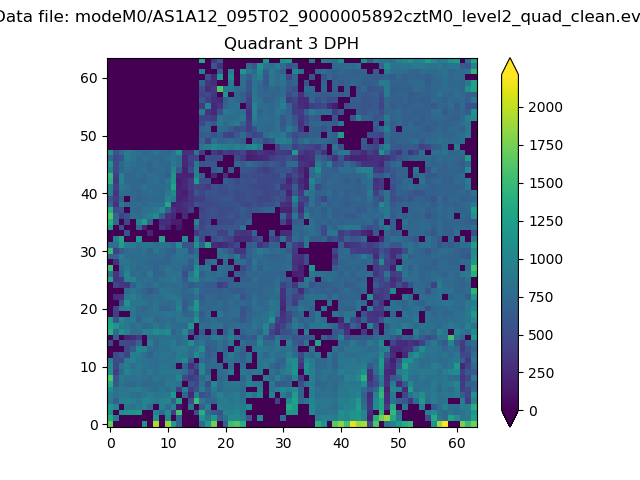 |
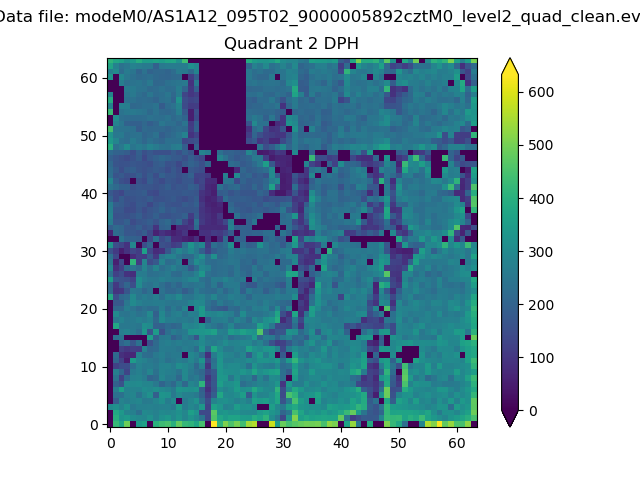 |
Quadrant C |
| Plot type | Count rate plots | Images |
|---|---|---|
| Comparison with Poisson distribution Blue bars denote a histogram of data divided into 1 sec bins. Red curve is a Poisson curve with rate = median count rate of data. |
 |
 |
| Quadrant-wise count rates Data is divided into 100 sec bins |
 |
|
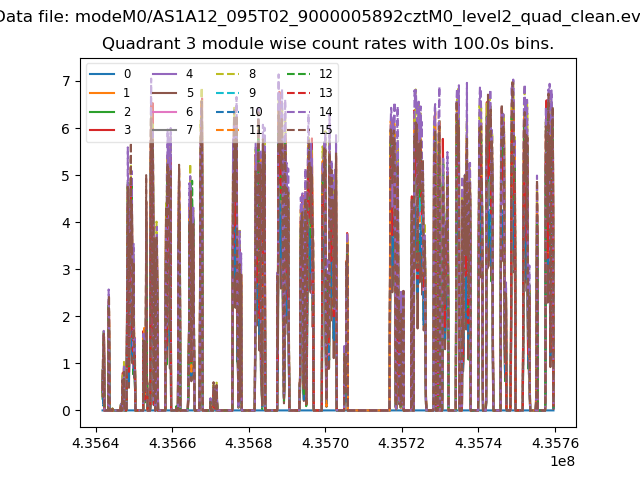
| Module-wise count rates for Quadrant A Data is divided into 100 sec bins |
 |
 |
| Module-wise count rates for Quadrant B Data is divided into 100 sec bins |
 |
 |
| Module-wise count rates for Quadrant C Data is divided into 100 sec bins |
 |
 |
| Module-wise count rates for Quadrant D Data is divided into 100 sec bins |
 |
 |
| Parameter | Plot |
|---|---|
| CZT HV Monitor |  |
| D_VDD | 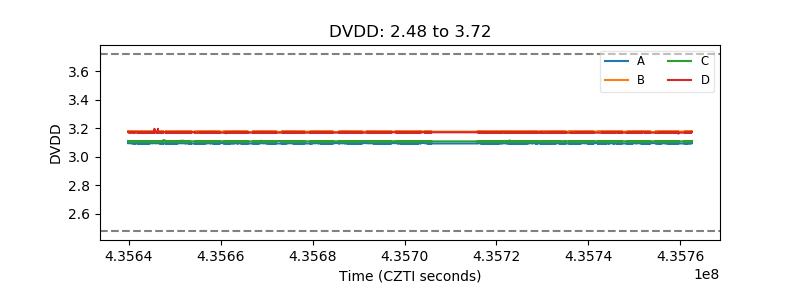 |
| Temperature 1 |  |
| Veto HV Monitor | 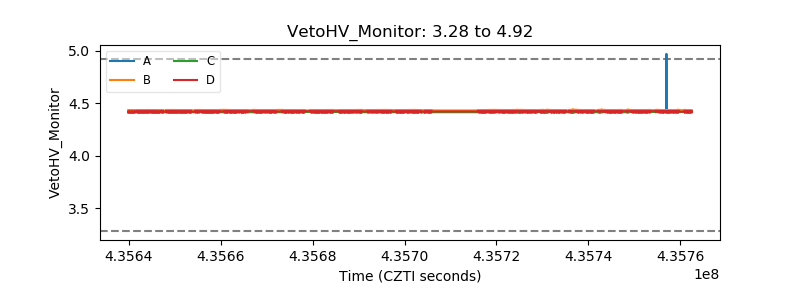 |
| Veto LLD | 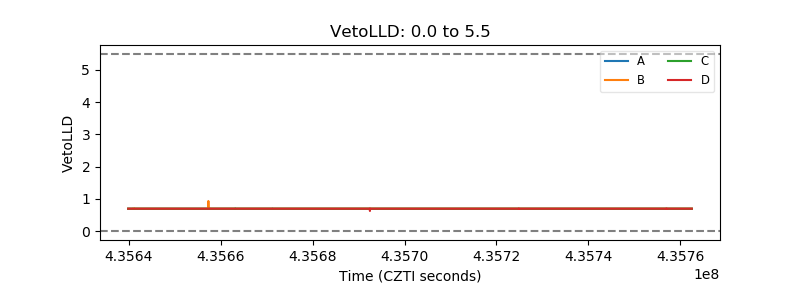 |
| Alpha Counter |  |
| _CPM_Rate |  |
| CZT Counter |  |
| +2.5 Volts monitor |  |
| +5 Volts monitor | 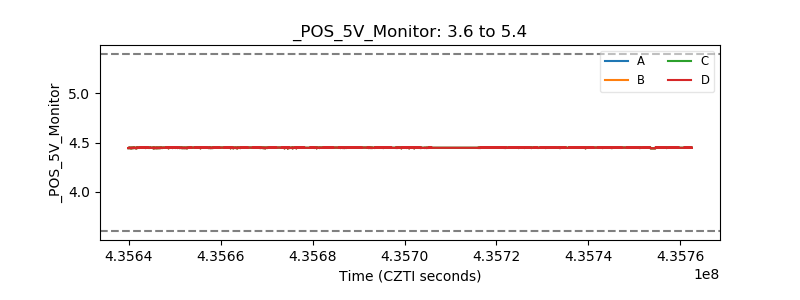 |
| _ROLL_ROT |  |
| _Roll_DEC |  |
| _Roll_RA |  |
| Veto Counter | 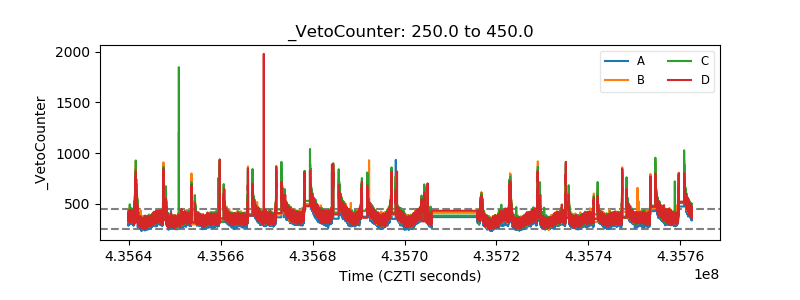 |