| Param | Original file | Final file |
|---|---|---|
| Filename | modeM0/AS1A12_068T05_9000005894cztM0_level2.fits | modeM0/AS1A12_068T05_9000005894cztM0_level2_quad_clean.evt |
| Size (bytes) | 986,374,080 | 1,074,398,400 |
| Size | 940.7 MB | 1.0 GB |
| Events in quadrant A | 7,050,316 | 8,608,220 |
| Events in quadrant B | 6,771,540 | 8,684,602 |
| Events in quadrant C | 3,057,028 | 1,845,368 |
| Events in quadrant D | 3,573,634 | 4,064,478 |
| Mode SS | |||
|---|---|---|---|
| Quadrant | BADHDUFLAG | Total packets | Discarded packets |
| A | 0 | 2765 | 0 |
| B | 0 | 2761 | 0 |
| C | 0 | 2768 | 0 |
| D | 0 | 2770 | 0 |
| Mode M9 | |||
|---|---|---|---|
| Quadrant | BADHDUFLAG | Total packets | Discarded packets |
| A | 0 | 156 | 0 |
| B | 0 | 156 | 0 |
| C | 0 | 157 | 0 |
| D | 0 | 156 | 0 |
| Mode M0 | |||
|---|---|---|---|
| Quadrant | BADHDUFLAG | Total packets | Discarded packets |
| A | 0 | 392956 | 0 |
| B | 0 | 371076 | 0 |
| C | 0 | 1074164 | 0 |
| D | 0 | 826831 | 0 |
| Quadrant | Total seconds | Saturated seconds | Saturation percentage |
|---|---|---|---|
| A | 136093 | 6115 | 4.493251% |
| B | 136111 | 7526 | 5.529311% |
| C | 135884 | 118655 | 87.320803% |
| D | 135895 | 71473 | 52.594282% |
Noise dominated data is calculated using 1-second bins in cleaned event files. If a bin has >2000 counts, and if more than 50% of those come from <1% of pixels, then it is considered to be noise-dominated and hence unusable.
| Quadrant | # 1 sec bins | Bins with >0 counts | Bins with >2000 counts | High rate bins dominated by noise | Noise dominated (total time) | Noise dominated (detector-on time) | Marked lightcurve |
|---|---|---|---|---|---|---|---|
| A | 157366 | 136097 | 0 | 0 | 0.00% | 0.00% | 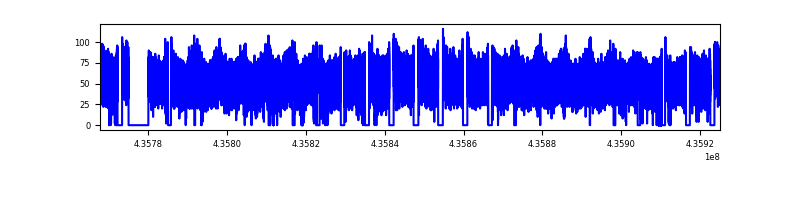 |
| B | 157366 | 136122 | 0 | 0 | 0.00% | 0.00% | 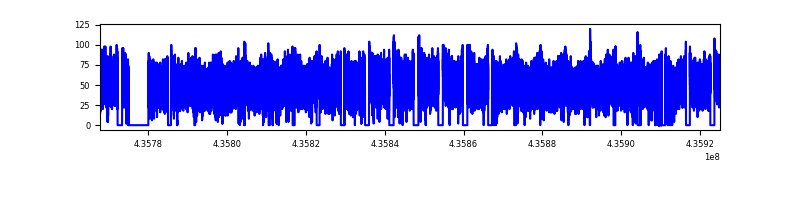 |
| C | 157365 | 133094 | 0 | 0 | 0.00% | 0.00% |  |
| D | 157365 | 123718 | 0 | 0 | 0.00% | 0.00% | 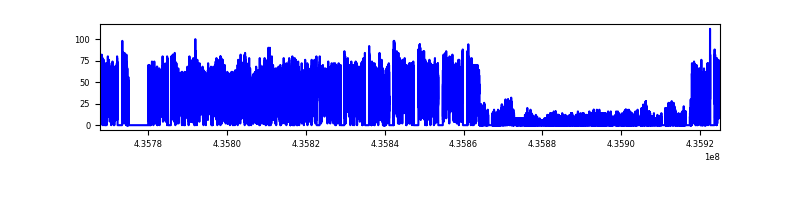 |
Top three noisy pixels from each quadrant. If the there are fewer than three noisy pixels in the level2.evt file, extra rows are filled as -1
| Pixel properties | Quadrant properties | ||||||
|---|---|---|---|---|---|---|---|
| Quadrant | DetID | PixID | Counts | Sigma | Mean | Median | Sigma |
| A | 0 | 29 | 6053 | 9.54 | 1847 | 1737 | 452.6 |
| A | 7 | 110 | 5801 | 8.98 | 1847 | 1737 | 452.6 |
| A | 0 | 30 | 5688 | 8.73 | 1847 | 1737 | 452.6 |
| B | 2 | 9 | 6047 | 12.45 | 1797 | 1713 | 348.2 |
| B | 3 | 17 | 5044 | 9.57 | 1797 | 1713 | 348.2 |
| B | 2 | 8 | 4882 | 9.1 | 1797 | 1713 | 348.2 |
| C | 3 | 202 | 2458 | 8.2 | 811 | 756 | 207.6 |
| C | 1 | 80 | 2440 | 8.11 | 811 | 756 | 207.6 |
| C | 1 | 81 | 2409 | 7.96 | 811 | 756 | 207.6 |
| D | 15 | 46 | 2782 | 6.45 | 1043 | 946 | 284.8 |
| D | 10 | 189 | 2713 | 6.2 | 1043 | 946 | 284.8 |
| D | 6 | 67 | 2668 | 6.05 | 1043 | 946 | 284.8 |
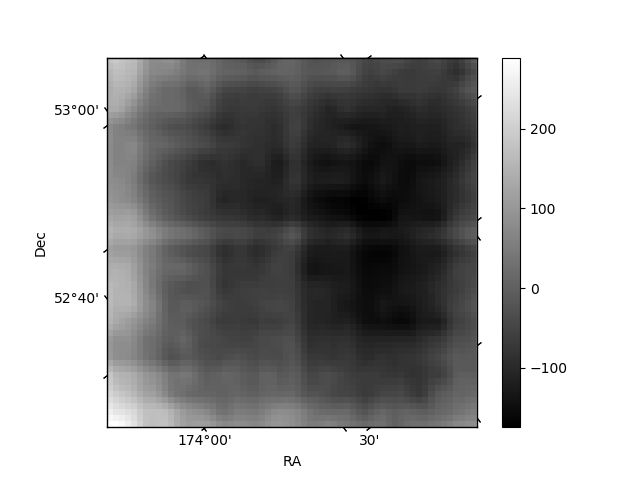
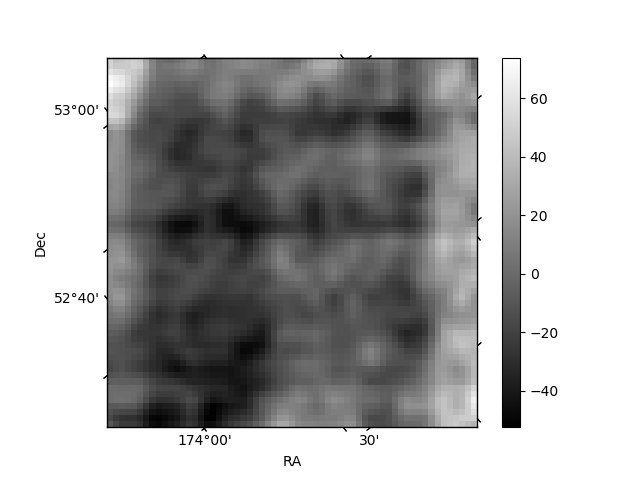
Histogram calculated using DETX and DETY for each event in the final _common_clean file
| Quadrant A | 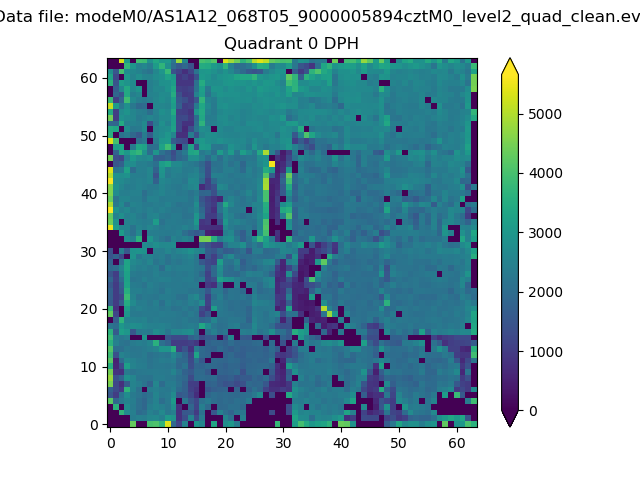 |
 |
Quadrant B |
|---|---|---|---|
| Quadrant D |  |
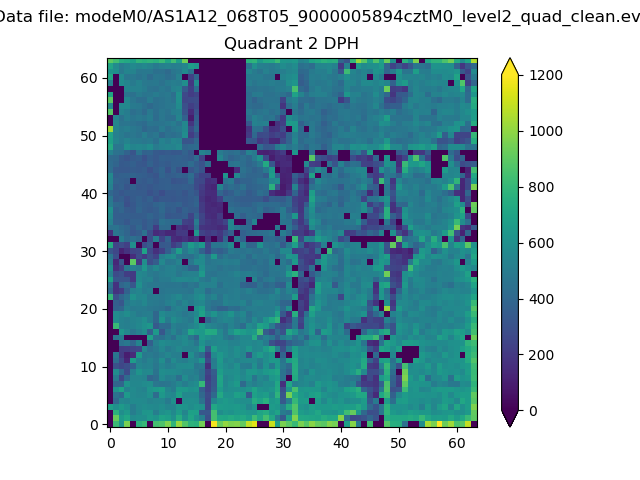 |
Quadrant C |
| Plot type | Count rate plots | Images |
|---|---|---|
| Comparison with Poisson distribution Blue bars denote a histogram of data divided into 1 sec bins. Red curve is a Poisson curve with rate = median count rate of data. |
 |
 |
| Quadrant-wise count rates Data is divided into 100 sec bins |
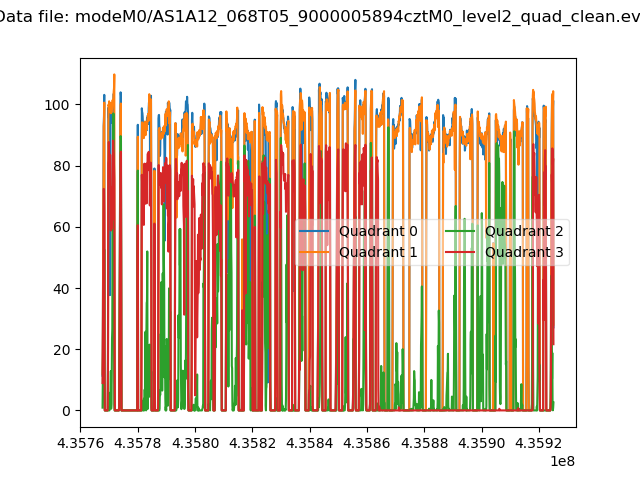 |
|
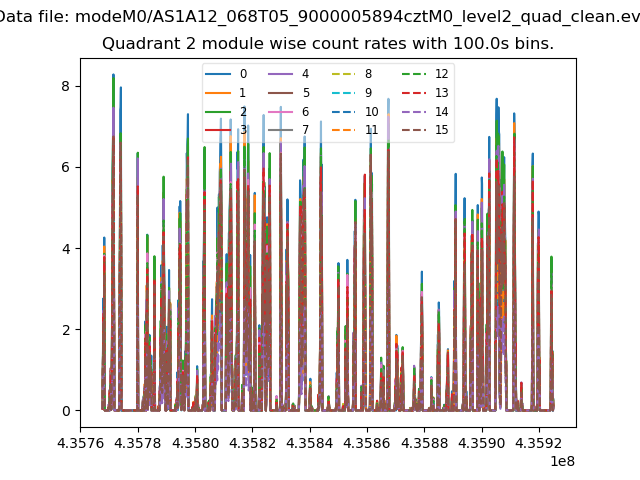
| Module-wise count rates for Quadrant A Data is divided into 100 sec bins |
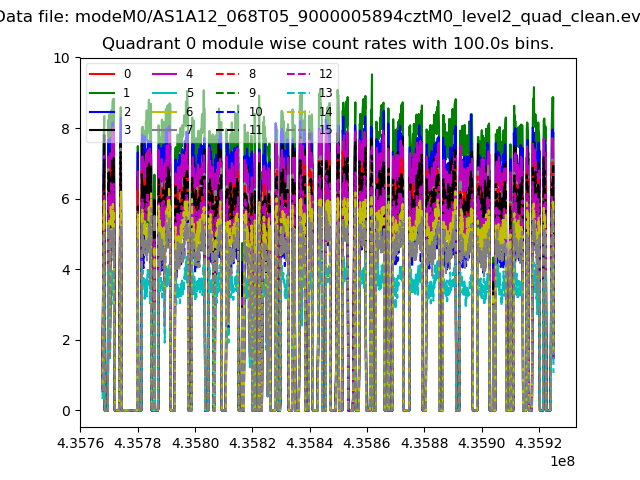 |
 |
| Module-wise count rates for Quadrant B Data is divided into 100 sec bins |
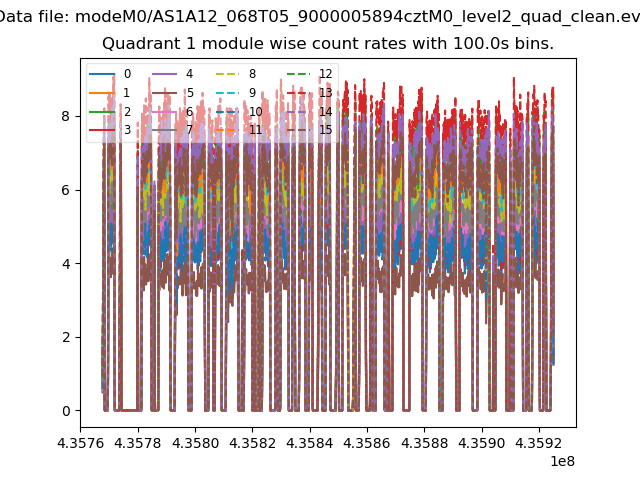 |
 |
| Module-wise count rates for Quadrant C Data is divided into 100 sec bins |
 |
 |
| Module-wise count rates for Quadrant D Data is divided into 100 sec bins |
 |
 |
| Parameter | Plot |
|---|---|
| CZT HV Monitor |  |
| D_VDD |  |
| Temperature 1 | 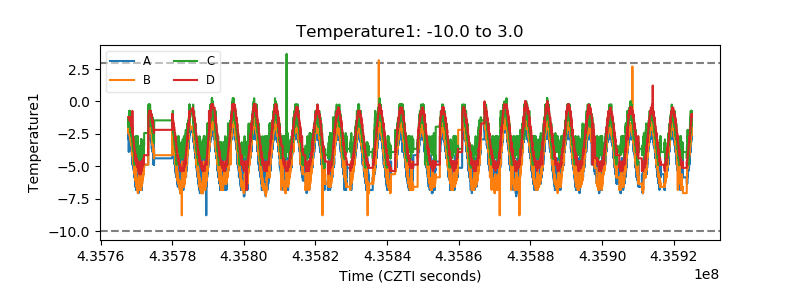 |
| Veto HV Monitor |  |
| Veto LLD | 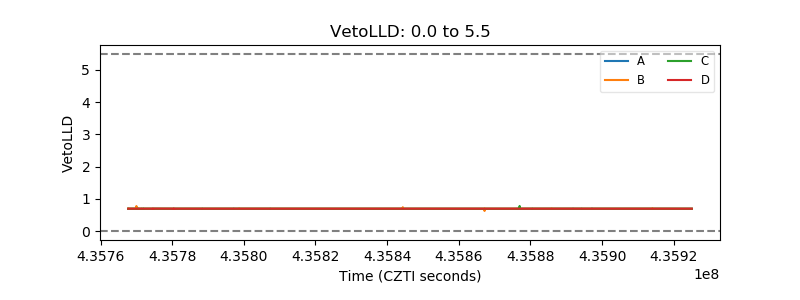 |
| Alpha Counter |  |
| _CPM_Rate |  |
| CZT Counter | 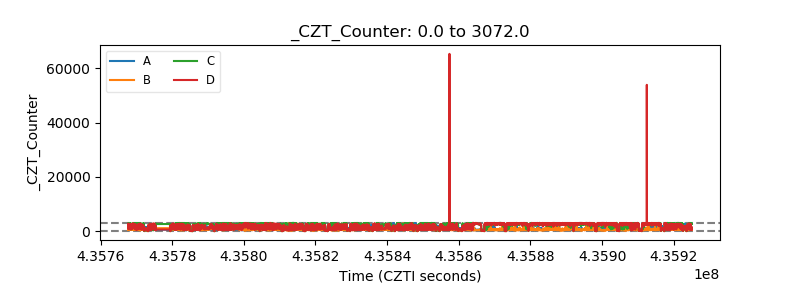 |
| +2.5 Volts monitor |  |
| +5 Volts monitor |  |
| _ROLL_ROT |  |
| _Roll_DEC |  |
| _Roll_RA | 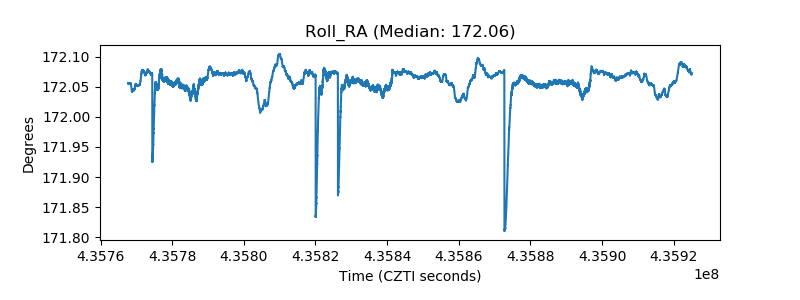 |
| Veto Counter |  |