| Param | Original file | Final file |
|---|---|---|
| Filename | modeM0/AS1A13_008T01_9000005898cztM0_level2.fits | modeM0/AS1A13_008T01_9000005898cztM0_level2_quad_clean.evt |
| Size (bytes) | 437,768,640 | 412,968,960 |
| Size | 417.5 MB | 393.8 MB |
| Events in quadrant A | 2,390,198 | 1,878,711 |
| Events in quadrant B | 2,786,596 | 2,892,238 |
| Events in quadrant C | 2,159,598 | 1,765,236 |
| Events in quadrant D | 2,325,376 | 2,395,272 |
| Mode M9 | |||
|---|---|---|---|
| Quadrant | BADHDUFLAG | Total packets | Discarded packets |
| A | 0 | 90 | 0 |
| B | 0 | 90 | 0 |
| C | 0 | 90 | 0 |
| D | 0 | 90 | 0 |
| Mode SS | |||
|---|---|---|---|
| Quadrant | BADHDUFLAG | Total packets | Discarded packets |
| A | 0 | 1062 | 0 |
| B | 0 | 1062 | 0 |
| C | 0 | 1062 | 0 |
| D | 0 | 1062 | 0 |
| Mode M0 | |||
|---|---|---|---|
| Quadrant | BADHDUFLAG | Total packets | Discarded packets |
| A | 0 | 317268 | 0 |
| B | 0 | 122971 | 0 |
| C | 0 | 280247 | 0 |
| D | 0 | 174561 | 0 |
| Quadrant | Total seconds | Saturated seconds | Saturation percentage |
|---|---|---|---|
| A | 52062 | 21460 | 41.220084% |
| B | 52062 | 1625 | 3.121278% |
| C | 52036 | 22849 | 43.909985% |
| D | 52062 | 5402 | 10.376090% |
Noise dominated data is calculated using 1-second bins in cleaned event files. If a bin has >2000 counts, and if more than 50% of those come from <1% of pixels, then it is considered to be noise-dominated and hence unusable.
| Quadrant | # 1 sec bins | Bins with >0 counts | Bins with >2000 counts | High rate bins dominated by noise | Noise dominated (total time) | Noise dominated (detector-on time) | Marked lightcurve |
|---|---|---|---|---|---|---|---|
| A | 61132 | 51975 | 0 | 0 | 0.00% | 0.00% |  |
| B | 61132 | 52061 | 0 | 0 | 0.00% | 0.00% |  |
| C | 61132 | 51846 | 0 | 0 | 0.00% | 0.00% |  |
| D | 61132 | 51916 | 0 | 0 | 0.00% | 0.00% |  |
Top three noisy pixels from each quadrant. If the there are fewer than three noisy pixels in the level2.evt file, extra rows are filled as -1
| Pixel properties | Quadrant properties | ||||||
|---|---|---|---|---|---|---|---|
| Quadrant | DetID | PixID | Counts | Sigma | Mean | Median | Sigma |
| A | 7 | 110 | 1900 | 8.56 | 625 | 584 | 153.7 |
| A | 15 | 236 | 1878 | 8.42 | 625 | 584 | 153.7 |
| A | 0 | 29 | 1866 | 8.34 | 625 | 584 | 153.7 |
| B | 2 | 9 | 2431 | 11.77 | 738 | 704 | 146.7 |
| B | 5 | 232 | 1987 | 8.75 | 738 | 704 | 146.7 |
| B | 3 | 17 | 1936 | 8.4 | 738 | 704 | 146.7 |
| C | 3 | 202 | 1704 | 7.88 | 572 | 531 | 148.8 |
| C | 3 | 203 | 1696 | 7.83 | 572 | 531 | 148.8 |
| C | 1 | 81 | 1608 | 7.24 | 572 | 531 | 148.8 |
| D | 7 | 3 | 1802 | 6.4 | 676 | 613 | 185.7 |
| D | 6 | 67 | 1790 | 6.34 | 676 | 613 | 185.7 |
| D | 10 | 189 | 1732 | 6.02 | 676 | 613 | 185.7 |
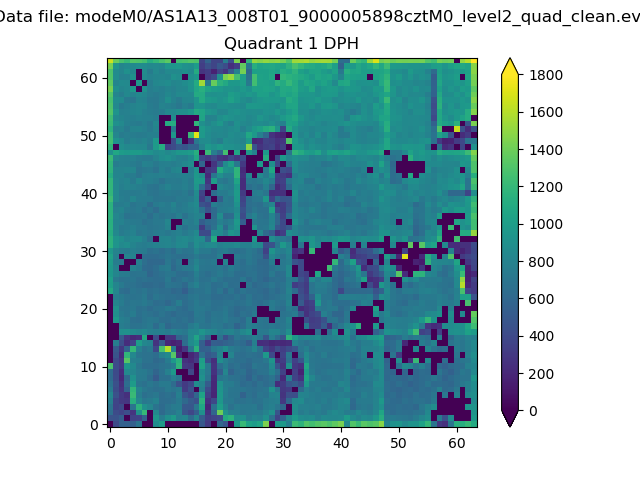
Histogram calculated using DETX and DETY for each event in the final _common_clean file
| Quadrant A |  |
 |
Quadrant B |
|---|---|---|---|
| Quadrant D | 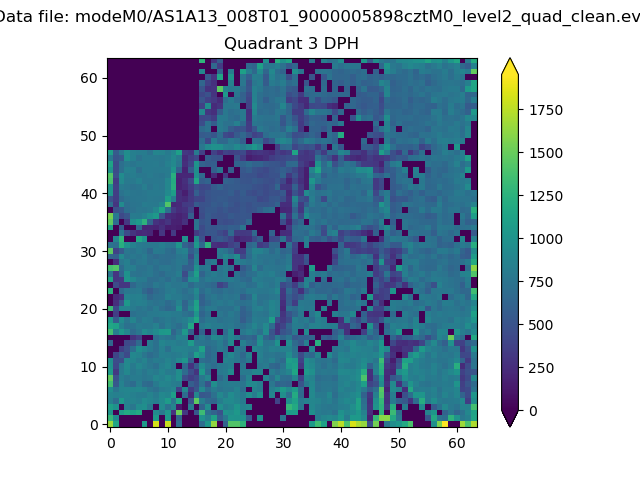 |
 |
Quadrant C |
| Plot type | Count rate plots | Images |
|---|---|---|
| Comparison with Poisson distribution Blue bars denote a histogram of data divided into 1 sec bins. Red curve is a Poisson curve with rate = median count rate of data. |
 |
 |
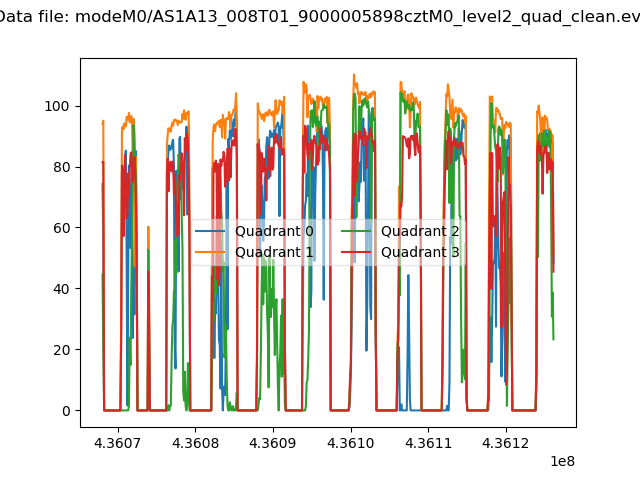
| Quadrant-wise count rates Data is divided into 100 sec bins |
 |
|
| Module-wise count rates for Quadrant A Data is divided into 100 sec bins |
 |
 |
| Module-wise count rates for Quadrant B Data is divided into 100 sec bins |
 |
 |
| Module-wise count rates for Quadrant C Data is divided into 100 sec bins |
 |
 |
| Module-wise count rates for Quadrant D Data is divided into 100 sec bins |
 |
 |
| Parameter | Plot |
|---|---|
| CZT HV Monitor |  |
| D_VDD |  |
| Temperature 1 |  |
| Veto HV Monitor |  |
| Veto LLD |  |
| Alpha Counter |  |
| _CPM_Rate |  |
| CZT Counter |  |
| +2.5 Volts monitor |  |
| +5 Volts monitor |  |
| _ROLL_ROT |  |
| _Roll_DEC |  |
| _Roll_RA |  |
| Veto Counter |  |