| Param | Original file | Final file |
|---|---|---|
| Filename | modeM0/AS1A13_008T02_9000005900cztM0_level2.fits | modeM0/AS1A13_008T02_9000005900cztM0_level2_quad_clean.evt |
| Size (bytes) | 630,881,280 | 635,523,840 |
| Size | 601.7 MB | 606.1 MB |
| Events in quadrant A | 3,690,362 | 3,715,278 |
| Events in quadrant B | 3,762,382 | 3,994,361 |
| Events in quadrant C | 3,781,708 | 3,838,647 |
| Events in quadrant D | 2,962,294 | 2,798,700 |
| Mode M9 | |||
|---|---|---|---|
| Quadrant | BADHDUFLAG | Total packets | Discarded packets |
| A | 0 | 91 | 0 |
| B | 0 | 91 | 0 |
| C | 0 | 91 | 0 |
| D | 0 | 91 | 0 |
| Mode M0 | |||
|---|---|---|---|
| Quadrant | BADHDUFLAG | Total packets | Discarded packets |
| A | 0 | 330368 | 0 |
| B | 0 | 168058 | 0 |
| C | 0 | 198129 | 0 |
| D | 0 | 284749 | 0 |
| Mode SS | |||
|---|---|---|---|
| Quadrant | BADHDUFLAG | Total packets | Discarded packets |
| A | 0 | 1450 | 0 |
| B | 0 | 1450 | 0 |
| C | 0 | 1450 | 0 |
| D | 0 | 1450 | 0 |
| Quadrant | Total seconds | Saturated seconds | Saturation percentage |
|---|---|---|---|
| A | 71419 | 6706 | 9.389658% |
| B | 71419 | 2211 | 3.095815% |
| C | 71419 | 4280 | 5.992803% |
| D | 71419 | 13336 | 18.672902% |
Noise dominated data is calculated using 1-second bins in cleaned event files. If a bin has >2000 counts, and if more than 50% of those come from <1% of pixels, then it is considered to be noise-dominated and hence unusable.
| Quadrant | # 1 sec bins | Bins with >0 counts | Bins with >2000 counts | High rate bins dominated by noise | Noise dominated (total time) | Noise dominated (detector-on time) | Marked lightcurve |
|---|---|---|---|---|---|---|---|
| A | 80585 | 71406 | 0 | 0 | 0.00% | 0.00% | 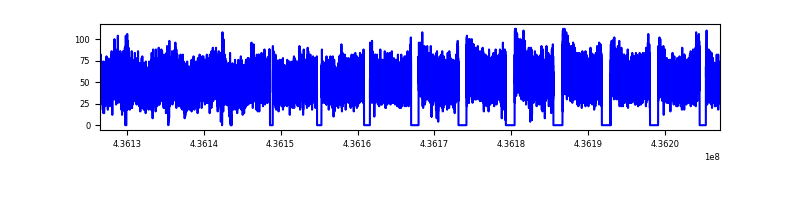 |
| B | 80585 | 71401 | 0 | 0 | 0.00% | 0.00% | 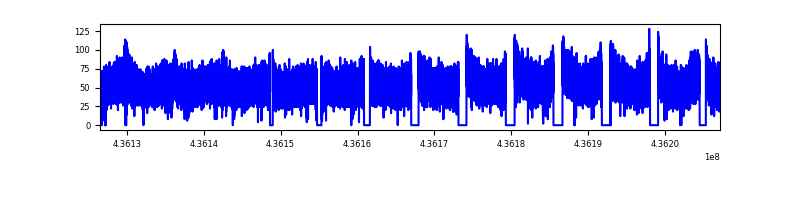 |
| C | 80585 | 71372 | 0 | 0 | 0.00% | 0.00% | 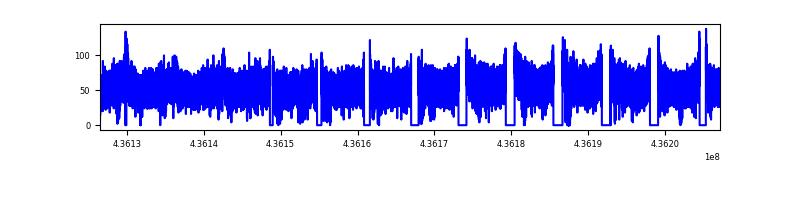 |
| D | 80585 | 71136 | 0 | 0 | 0.00% | 0.00% |  |
Top three noisy pixels from each quadrant. If the there are fewer than three noisy pixels in the level2.evt file, extra rows are filled as -1
| Pixel properties | Quadrant properties | ||||||
|---|---|---|---|---|---|---|---|
| Quadrant | DetID | PixID | Counts | Sigma | Mean | Median | Sigma |
| A | 0 | 29 | 3070 | 9.07 | 963 | 901 | 239.3 |
| A | 0 | 30 | 3017 | 8.84 | 963 | 901 | 239.3 |
| A | 7 | 110 | 2945 | 8.54 | 963 | 901 | 239.3 |
| B | 2 | 9 | 3241 | 11.57 | 997 | 948 | 198.1 |
| B | 3 | 17 | 2751 | 9.1 | 997 | 948 | 198.1 |
| B | 2 | 8 | 2589 | 8.28 | 997 | 948 | 198.1 |
| C | 3 | 202 | 3029 | 8.02 | 1002 | 931 | 261.4 |
| C | 1 | 80 | 2892 | 7.5 | 1002 | 931 | 261.4 |
| C | 1 | 81 | 2889 | 7.49 | 1002 | 931 | 261.4 |
| D | 10 | 189 | 2212 | 6.09 | 860 | 780 | 234.9 |
| D | 10 | 113 | 2195 | 6.02 | 860 | 780 | 234.9 |
| D | 7 | 3 | 2186 | 5.98 | 860 | 780 | 234.9 |
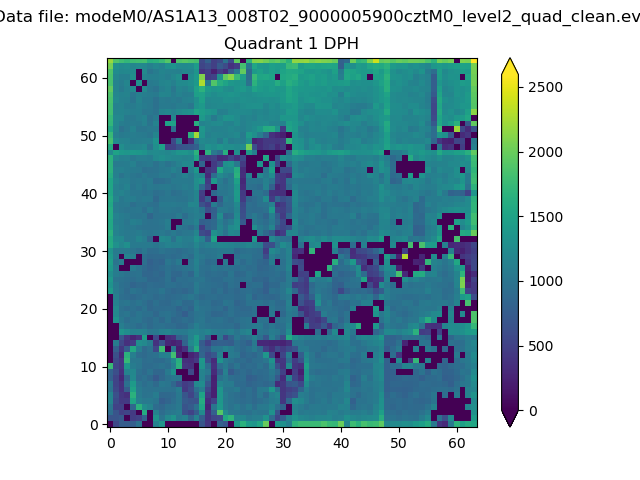
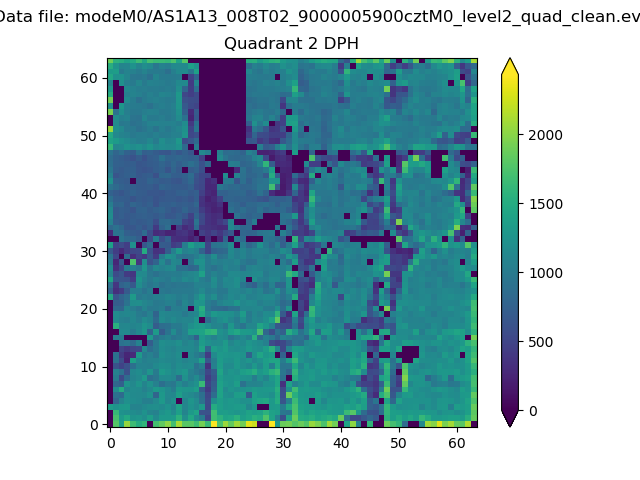
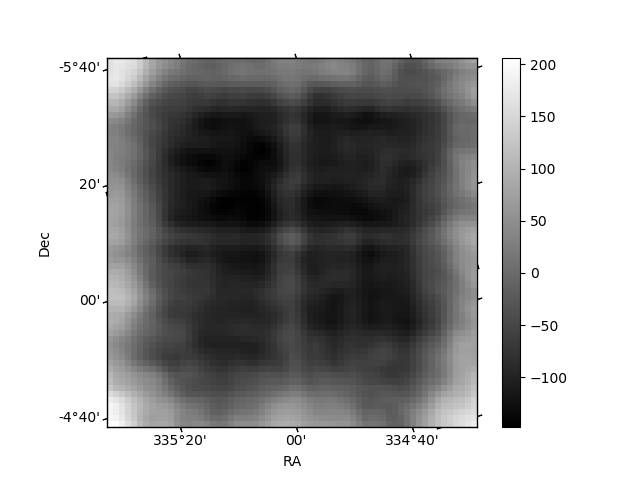
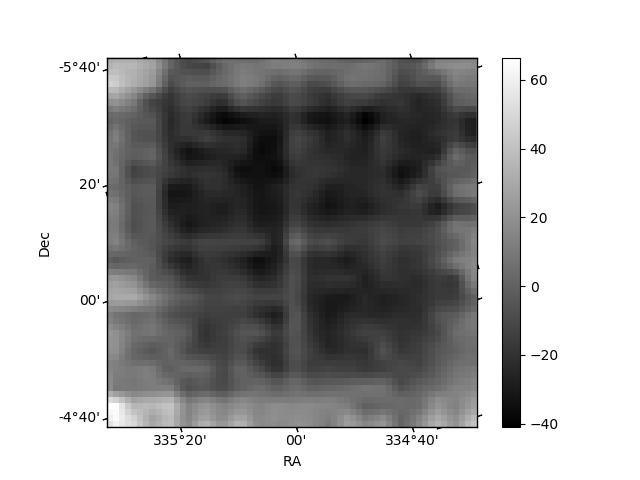
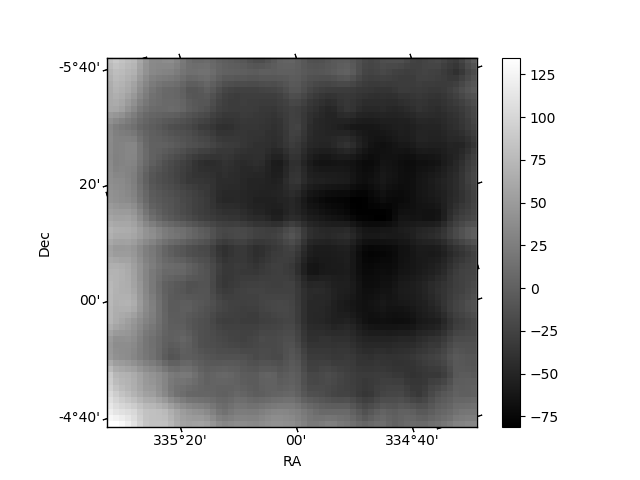
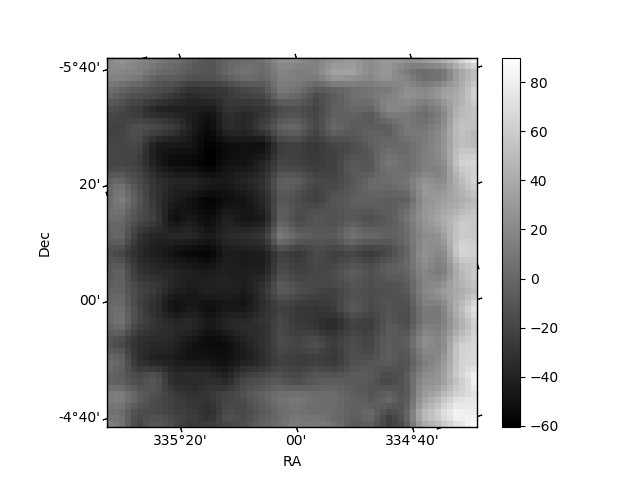
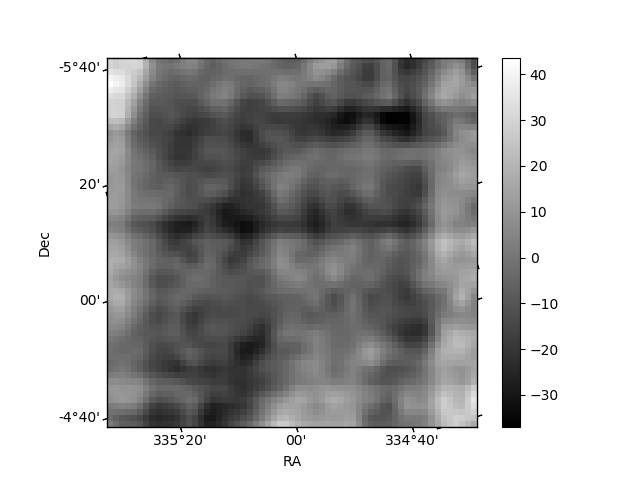
Histogram calculated using DETX and DETY for each event in the final _common_clean file
| Quadrant A | 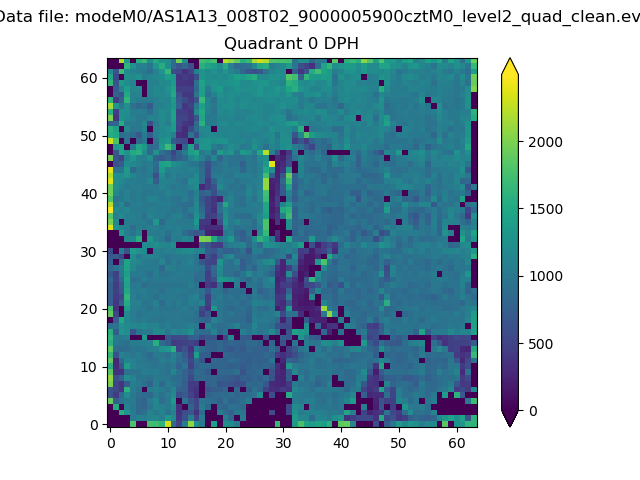 |
 |
Quadrant B |
|---|---|---|---|
| Quadrant D | 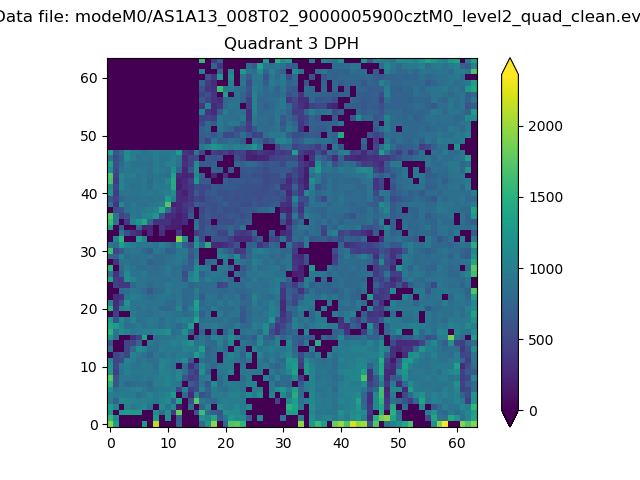 |
 |
Quadrant C |
| Plot type | Count rate plots | Images |
|---|---|---|
| Comparison with Poisson distribution Blue bars denote a histogram of data divided into 1 sec bins. Red curve is a Poisson curve with rate = median count rate of data. |
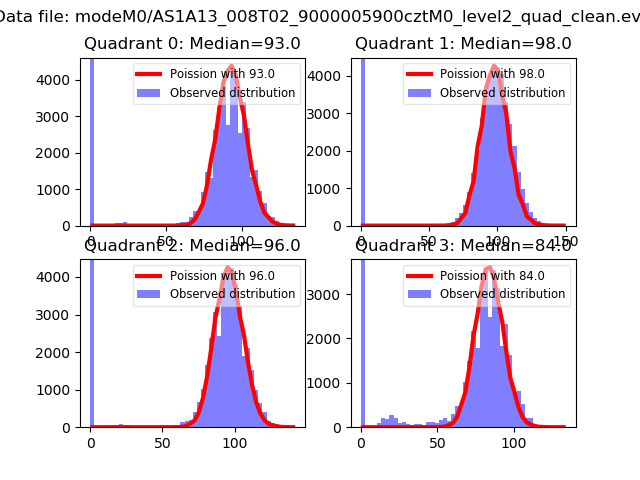 |
 |
| Quadrant-wise count rates Data is divided into 100 sec bins |
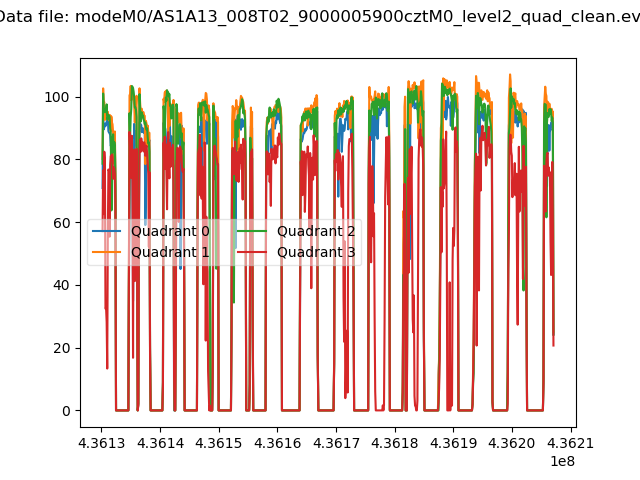 |
|
| Module-wise count rates for Quadrant A Data is divided into 100 sec bins |
 |
 |
| Module-wise count rates for Quadrant B Data is divided into 100 sec bins |
 |
 |
| Module-wise count rates for Quadrant C Data is divided into 100 sec bins |
 |
 |
| Module-wise count rates for Quadrant D Data is divided into 100 sec bins |
 |
 |
| Parameter | Plot |
|---|---|
| CZT HV Monitor |  |
| D_VDD | 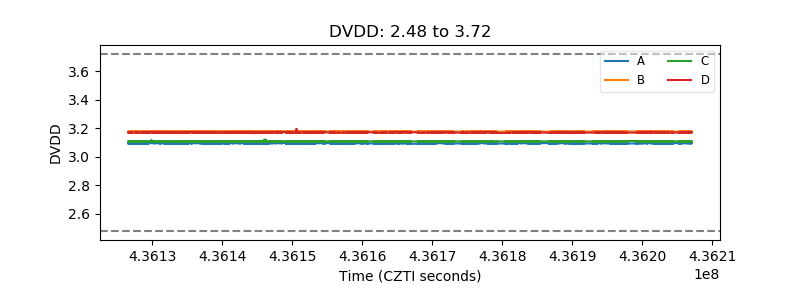 |
| Temperature 1 |  |
| Veto HV Monitor |  |
| Veto LLD |  |
| Alpha Counter | 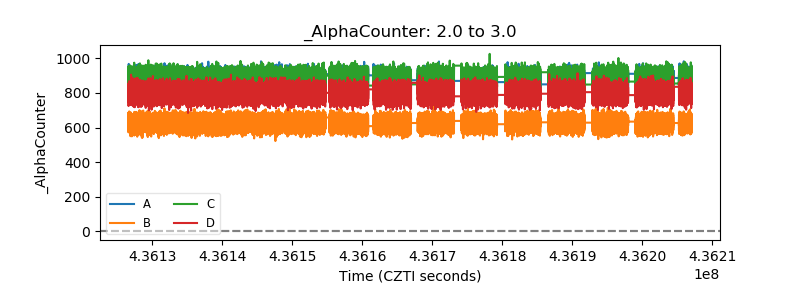 |
| _CPM_Rate | 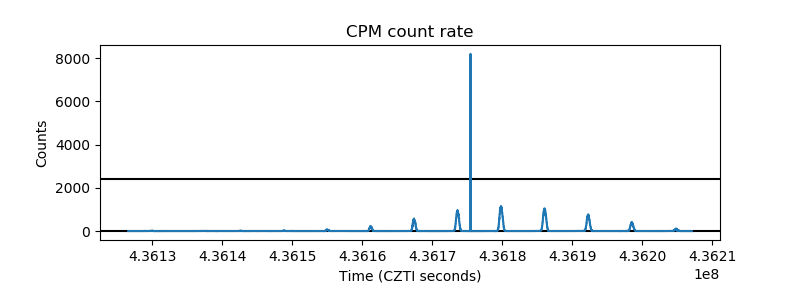 |
| CZT Counter | 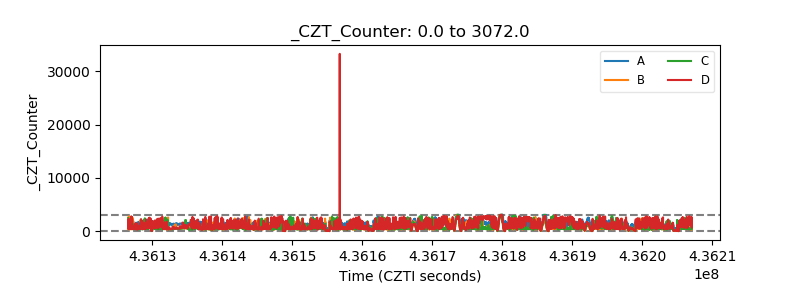 |
| +2.5 Volts monitor |  |
| +5 Volts monitor | 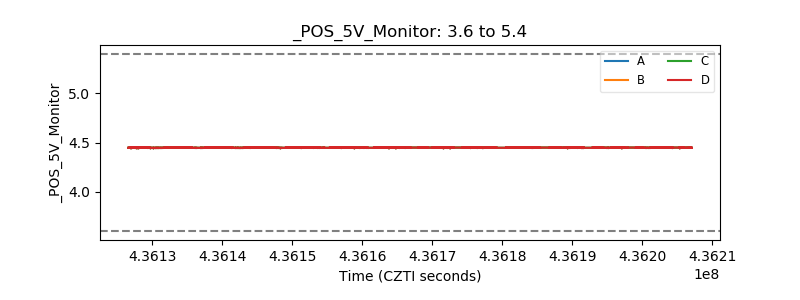 |
| _ROLL_ROT | 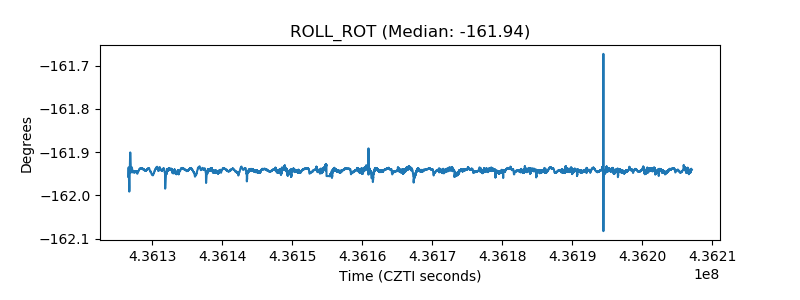 |
| _Roll_DEC | 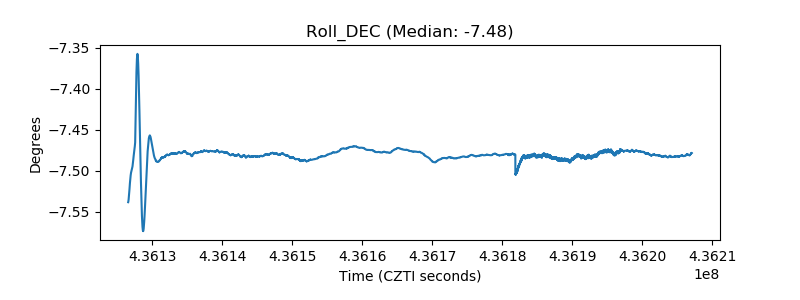 |
| _Roll_RA | 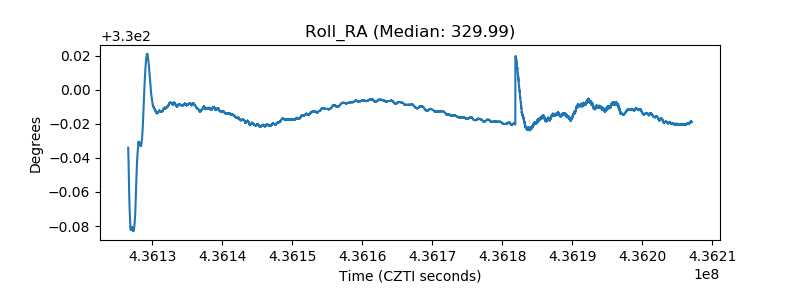 |
| Veto Counter | 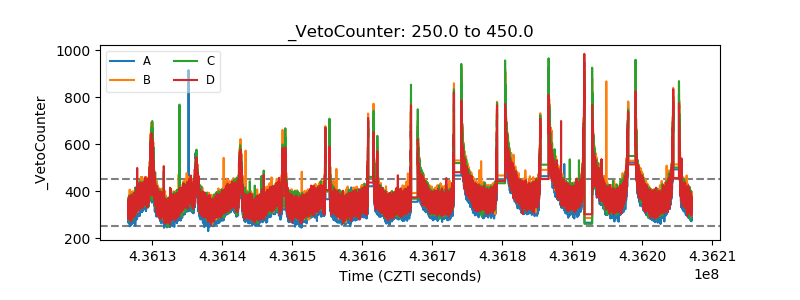 |