| Param | Original file | Final file |
|---|---|---|
| Filename | modeM0/AS1A13_026T01_9000005904cztM0_level2.fits | modeM0/AS1A13_026T01_9000005904cztM0_level2_quad_clean.evt |
| Size (bytes) | 1,611,815,040 | 1,554,082,560 |
| Size | 1.5 GB | 1.4 GB |
| Events in quadrant A | 9,757,776 | 9,442,916 |
| Events in quadrant B | 9,477,976 | 9,584,407 |
| Events in quadrant C | 9,611,164 | 9,141,739 |
| Events in quadrant D | 7,437,726 | 6,400,577 |
| Mode M0 | |||
|---|---|---|---|
| Quadrant | BADHDUFLAG | Total packets | Discarded packets |
| A | 0 | 603033 | 0 |
| B | 0 | 505899 | 0 |
| C | 0 | 558930 | 0 |
| D | 0 | 774643 | 0 |
| Mode SS | |||
|---|---|---|---|
| Quadrant | BADHDUFLAG | Total packets | Discarded packets |
| A | 0 | 3598 | 0 |
| B | 0 | 3704 | 0 |
| C | 0 | 3704 | 0 |
| D | 0 | 3704 | 0 |
| Mode M9 | |||
|---|---|---|---|
| Quadrant | BADHDUFLAG | Total packets | Discarded packets |
| A | 0 | 243 | 0 |
| B | 0 | 243 | 0 |
| C | 0 | 243 | 0 |
| D | 0 | 243 | 0 |
| Quadrant | Total seconds | Saturated seconds | Saturation percentage |
|---|---|---|---|
| A | 182411 | 13998 | 7.673879% |
| B | 182411 | 12543 | 6.876230% |
| C | 182411 | 16384 | 8.981914% |
| D | 182408 | 43661 | 23.935902% |
Noise dominated data is calculated using 1-second bins in cleaned event files. If a bin has >2000 counts, and if more than 50% of those come from <1% of pixels, then it is considered to be noise-dominated and hence unusable.
| Quadrant | # 1 sec bins | Bins with >0 counts | Bins with >2000 counts | High rate bins dominated by noise | Noise dominated (total time) | Noise dominated (detector-on time) | Marked lightcurve |
|---|---|---|---|---|---|---|---|
| A | 206791 | 182122 | 0 | 0 | 0.00% | 0.00% |  |
| B | 206791 | 182301 | 0 | 0 | 0.00% | 0.00% |  |
| C | 206791 | 182335 | 0 | 0 | 0.00% | 0.00% |  |
| D | 206791 | 181576 | 0 | 0 | 0.00% | 0.00% |  |
Top three noisy pixels from each quadrant. If the there are fewer than three noisy pixels in the level2.evt file, extra rows are filled as -1
| Pixel properties | Quadrant properties | ||||||
|---|---|---|---|---|---|---|---|
| Quadrant | DetID | PixID | Counts | Sigma | Mean | Median | Sigma |
| A | 0 | 29 | 8038 | 9.03 | 2549 | 2389 | 625.8 |
| A | 7 | 110 | 7925 | 8.85 | 2549 | 2389 | 625.8 |
| A | 0 | 30 | 7640 | 8.39 | 2549 | 2389 | 625.8 |
| B | 2 | 9 | 8465 | 12.47 | 2517 | 2399 | 486.4 |
| B | 3 | 17 | 6841 | 9.13 | 2517 | 2399 | 486.4 |
| B | 2 | 8 | 6646 | 8.73 | 2517 | 2399 | 486.4 |
| C | 1 | 81 | 7754 | 8.23 | 2546 | 2370 | 654.3 |
| C | 1 | 80 | 7556 | 7.93 | 2546 | 2370 | 654.3 |
| C | 3 | 202 | 7545 | 7.91 | 2546 | 2370 | 654.3 |
| D | 6 | 67 | 5605 | 6.08 | 2163 | 1966 | 598.4 |
| D | 10 | 189 | 5563 | 6.01 | 2163 | 1966 | 598.4 |
| D | 7 | 3 | 5491 | 5.89 | 2163 | 1966 | 598.4 |
Histogram calculated using DETX and DETY for each event in the final _common_clean file
| Quadrant A | 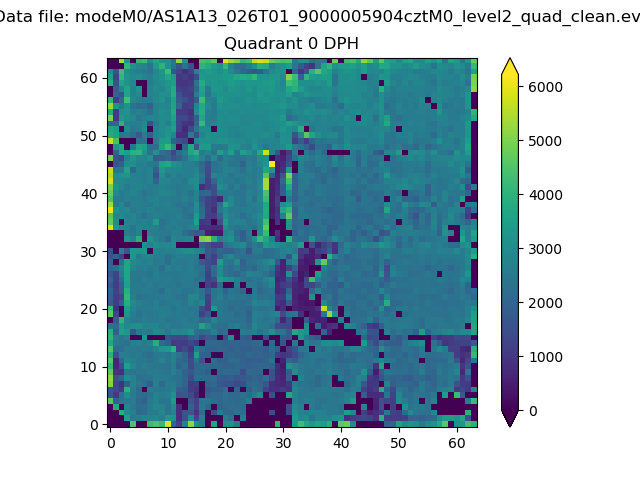 |
 |
Quadrant B |
|---|---|---|---|
| Quadrant D | 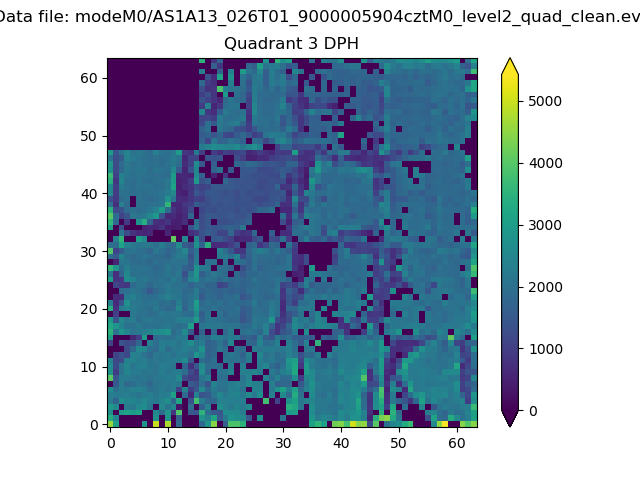 |
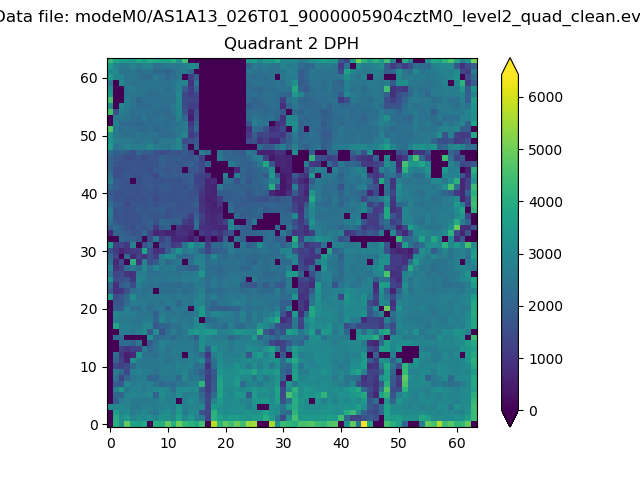 |
Quadrant C |
| Plot type | Count rate plots | Images |
|---|---|---|
| Comparison with Poisson distribution Blue bars denote a histogram of data divided into 1 sec bins. Red curve is a Poisson curve with rate = median count rate of data. |
 |
 |
| Quadrant-wise count rates Data is divided into 100 sec bins |
 |
|
| Module-wise count rates for Quadrant A Data is divided into 100 sec bins |
 |
 |
| Module-wise count rates for Quadrant B Data is divided into 100 sec bins |
 |
 |
| Module-wise count rates for Quadrant C Data is divided into 100 sec bins |
 |
 |
| Module-wise count rates for Quadrant D Data is divided into 100 sec bins |
 |
 |
| Parameter | Plot |
|---|---|
| CZT HV Monitor | 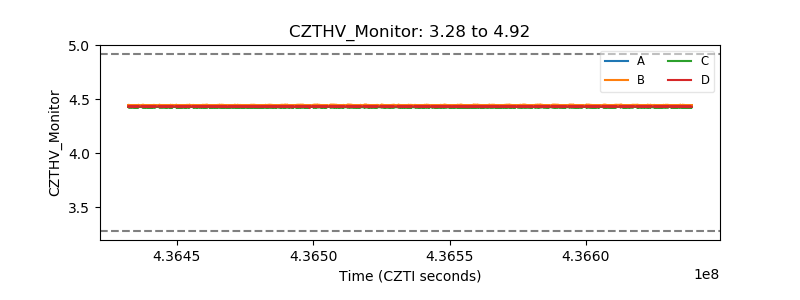 |
| D_VDD |  |
| Temperature 1 | 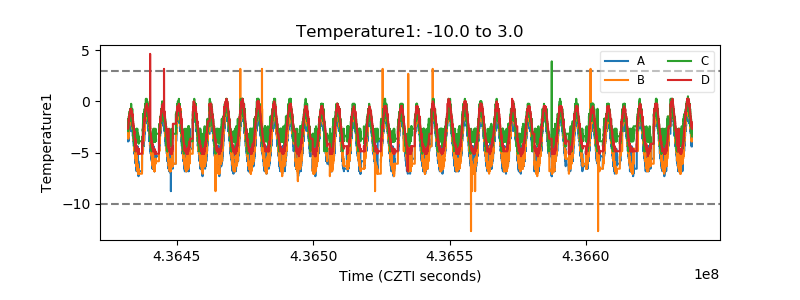 |
| Veto HV Monitor |  |
| Veto LLD |  |
| Alpha Counter |  |
| _CPM_Rate |  |
| CZT Counter |  |
| +2.5 Volts monitor |  |
| +5 Volts monitor |  |
| _ROLL_ROT |  |
| _Roll_DEC |  |
| _Roll_RA |  |
| Veto Counter |  |