| Param | Original file | Final file |
|---|---|---|
| Filename | modeM0/AS1A13_073T04_9000005912cztM0_level2.fits | modeM0/AS1A13_073T04_9000005912cztM0_level2_quad_clean.evt |
| Size (bytes) | 110,952,000 | 89,328,960 |
| Size | 105.8 MB | 85.2 MB |
| Events in quadrant A | 600,798 | 430,228 |
| Events in quadrant B | 648,534 | 501,627 |
| Events in quadrant C | 671,742 | 484,133 |
| Events in quadrant D | 544,822 | 395,616 |
| Mode M0 | |||
|---|---|---|---|
| Quadrant | BADHDUFLAG | Total packets | Discarded packets |
| A | 0 | 53473 | 0 |
| B | 0 | 29888 | 0 |
| C | 0 | 27169 | 0 |
| D | 0 | 40186 | 0 |
| Mode M9 | |||
|---|---|---|---|
| Quadrant | BADHDUFLAG | Total packets | Discarded packets |
| A | 0 | 30 | 0 |
| B | 0 | 30 | 0 |
| C | 0 | 30 | 0 |
| D | 0 | 30 | 0 |
| Mode SS | |||
|---|---|---|---|
| Quadrant | BADHDUFLAG | Total packets | Discarded packets |
| A | 0 | 264 | 0 |
| B | 0 | 264 | 0 |
| C | 0 | 264 | 0 |
| D | 0 | 264 | 0 |
| Quadrant | Total seconds | Saturated seconds | Saturation percentage |
|---|---|---|---|
| A | 12914 | 2648 | 20.504878% |
| B | 12914 | 347 | 2.687006% |
| C | 12914 | 66 | 0.511073% |
| D | 12914 | 1216 | 9.416138% |
Noise dominated data is calculated using 1-second bins in cleaned event files. If a bin has >2000 counts, and if more than 50% of those come from <1% of pixels, then it is considered to be noise-dominated and hence unusable.
| Quadrant | # 1 sec bins | Bins with >0 counts | Bins with >2000 counts | High rate bins dominated by noise | Noise dominated (total time) | Noise dominated (detector-on time) | Marked lightcurve |
|---|---|---|---|---|---|---|---|
| A | 15929 | 12890 | 0 | 0 | 0.00% | 0.00% |  |
| B | 15929 | 12912 | 0 | 0 | 0.00% | 0.00% |  |
| C | 15929 | 12914 | 0 | 0 | 0.00% | 0.00% |  |
| D | 15928 | 12828 | 0 | 0 | 0.00% | 0.00% |  |
Top three noisy pixels from each quadrant. If the there are fewer than three noisy pixels in the level2.evt file, extra rows are filled as -1
| Pixel properties | Quadrant properties | ||||||
|---|---|---|---|---|---|---|---|
| Quadrant | DetID | PixID | Counts | Sigma | Mean | Median | Sigma |
| A | 14 | 237 | 658 | 12.21 | 156 | 147 | 41.9 |
| A | 14 | 238 | 617 | 11.23 | 156 | 147 | 41.9 |
| A | 7 | 110 | 502 | 8.48 | 156 | 147 | 41.9 |
| B | 2 | 9 | 582 | 11.72 | 171 | 163 | 35.8 |
| B | 2 | 8 | 472 | 8.64 | 171 | 163 | 35.8 |
| B | 5 | 128 | 459 | 8.28 | 171 | 163 | 35.8 |
| C | 1 | 81 | 563 | 8.34 | 178 | 167 | 47.5 |
| C | 1 | 80 | 525 | 7.54 | 178 | 167 | 47.5 |
| C | 1 | 65 | 457 | 6.11 | 178 | 167 | 47.5 |
| D | 3 | 14 | 416 | 6.12 | 156 | 143 | 44.6 |
| D | 15 | 46 | 410 | 5.99 | 156 | 143 | 44.6 |
| D | 10 | 189 | 404 | 5.85 | 156 | 143 | 44.6 |
Histogram calculated using DETX and DETY for each event in the final _common_clean file
| Quadrant A | 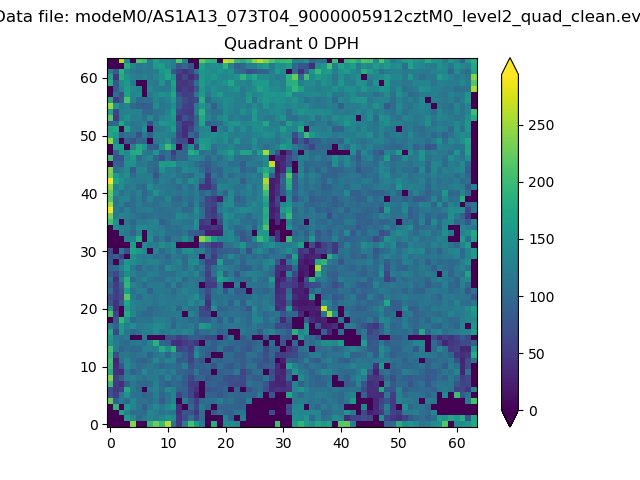 |
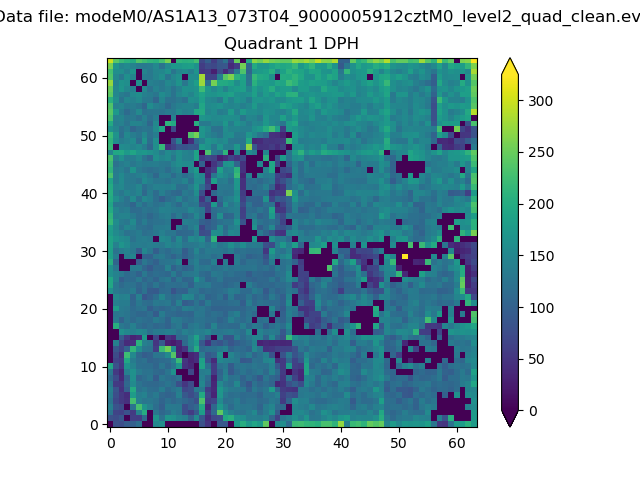 |
Quadrant B |
|---|---|---|---|
| Quadrant D |  |
 |
Quadrant C |
| Plot type | Count rate plots | Images |
|---|---|---|
| Comparison with Poisson distribution Blue bars denote a histogram of data divided into 1 sec bins. Red curve is a Poisson curve with rate = median count rate of data. |
 |
 |
| Quadrant-wise count rates Data is divided into 100 sec bins |
 |
|
| Module-wise count rates for Quadrant A Data is divided into 100 sec bins |
 |
 |
| Module-wise count rates for Quadrant B Data is divided into 100 sec bins |
 |
 |
| Module-wise count rates for Quadrant C Data is divided into 100 sec bins |
 |
 |
| Module-wise count rates for Quadrant D Data is divided into 100 sec bins |
 |
 |
| Parameter | Plot |
|---|---|
| CZT HV Monitor |  |
| D_VDD | 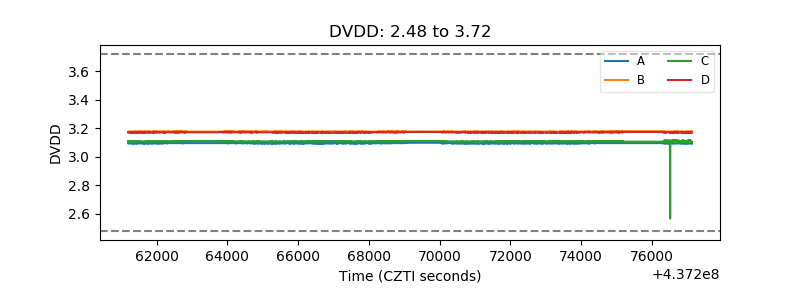 |
| Temperature 1 |  |
| Veto HV Monitor |  |
| Veto LLD |  |
| Alpha Counter |  |
| _CPM_Rate |  |
| CZT Counter |  |
| +2.5 Volts monitor |  |
| +5 Volts monitor |  |
| _ROLL_ROT |  |
| _Roll_DEC |  |
| _Roll_RA |  |
| Veto Counter |  |