| Param | Original file | Final file |
|---|---|---|
| Filename | modeM0/AS1C07_001T10_9000005910cztM0_level2.fits | modeM0/AS1C07_001T10_9000005910cztM0_level2_quad_clean.evt |
| Size (bytes) | 382,723,200 | 484,427,520 |
| Size | 365.0 MB | 462.0 MB |
| Events in quadrant A | 2,234,798 | 3,016,191 |
| Events in quadrant B | 2,218,172 | 3,166,868 |
| Events in quadrant C | 2,244,678 | 2,955,504 |
| Events in quadrant D | 1,822,590 | 2,465,996 |
| Mode M9 | |||
|---|---|---|---|
| Quadrant | BADHDUFLAG | Total packets | Discarded packets |
| A | 0 | 25 | 0 |
| B | 0 | 25 | 0 |
| C | 0 | 25 | 0 |
| D | 0 | 25 | 0 |
| Mode M0 | |||
|---|---|---|---|
| Quadrant | BADHDUFLAG | Total packets | Discarded packets |
| A | 0 | 133684 | 0 |
| B | 0 | 99153 | 0 |
| C | 0 | 104048 | 0 |
| D | 0 | 144999 | 0 |
| Mode SS | |||
|---|---|---|---|
| Quadrant | BADHDUFLAG | Total packets | Discarded packets |
| A | 0 | 904 | 0 |
| B | 0 | 904 | 0 |
| C | 0 | 904 | 0 |
| D | 0 | 904 | 0 |
| Quadrant | Total seconds | Saturated seconds | Saturation percentage |
|---|---|---|---|
| A | 44670 | 2236 | 5.005597% |
| B | 44672 | 928 | 2.077364% |
| C | 44672 | 1046 | 2.341511% |
| D | 44672 | 5091 | 11.396400% |
Noise dominated data is calculated using 1-second bins in cleaned event files. If a bin has >2000 counts, and if more than 50% of those come from <1% of pixels, then it is considered to be noise-dominated and hence unusable.
| Quadrant | # 1 sec bins | Bins with >0 counts | Bins with >2000 counts | High rate bins dominated by noise | Noise dominated (total time) | Noise dominated (detector-on time) | Marked lightcurve |
|---|---|---|---|---|---|---|---|
| A | 52304 | 44642 | 0 | 0 | 0.00% | 0.00% |  |
| B | 52306 | 44672 | 0 | 0 | 0.00% | 0.00% |  |
| C | 52305 | 44668 | 0 | 0 | 0.00% | 0.00% |  |
| D | 52306 | 44389 | 0 | 0 | 0.00% | 0.00% |  |
Top three noisy pixels from each quadrant. If the there are fewer than three noisy pixels in the level2.evt file, extra rows are filled as -1
| Pixel properties | Quadrant properties | ||||||
|---|---|---|---|---|---|---|---|
| Quadrant | DetID | PixID | Counts | Sigma | Mean | Median | Sigma |
| A | 15 | 236 | 1820 | 8.71 | 583 | 544 | 146.6 |
| A | 7 | 110 | 1817 | 8.69 | 583 | 544 | 146.6 |
| A | 0 | 29 | 1776 | 8.41 | 583 | 544 | 146.6 |
| B | 2 | 9 | 2022 | 12.51 | 587 | 560 | 116.8 |
| B | 2 | 8 | 1649 | 9.32 | 587 | 560 | 116.8 |
| B | 5 | 255 | 1528 | 8.28 | 587 | 560 | 116.8 |
| C | 3 | 202 | 1815 | 8.12 | 595 | 553 | 155.4 |
| C | 1 | 80 | 1755 | 7.74 | 595 | 553 | 155.4 |
| C | 1 | 81 | 1726 | 7.55 | 595 | 553 | 155.4 |
| D | 10 | 189 | 1379 | 6.15 | 525 | 476 | 146.8 |
| D | 3 | 14 | 1339 | 5.88 | 525 | 476 | 146.8 |
| D | 7 | 3 | 1324 | 5.78 | 525 | 476 | 146.8 |
Histogram calculated using DETX and DETY for each event in the final _common_clean file
| Quadrant A |  |
 |
Quadrant B |
|---|---|---|---|
| Quadrant D | 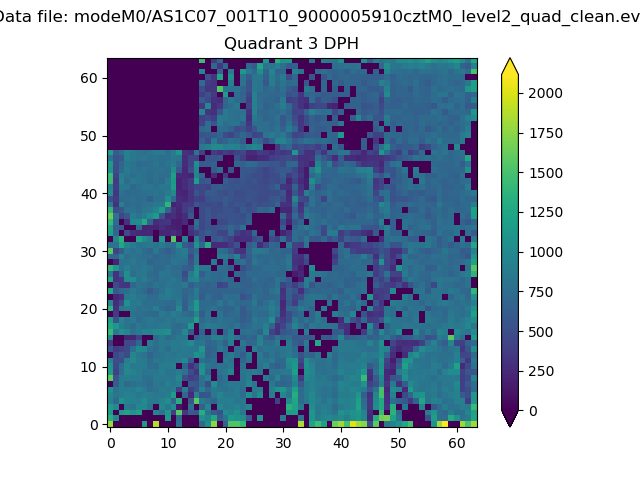 |
 |
Quadrant C |
| Plot type | Count rate plots | Images |
|---|---|---|
| Comparison with Poisson distribution Blue bars denote a histogram of data divided into 1 sec bins. Red curve is a Poisson curve with rate = median count rate of data. |
 |
 |
| Quadrant-wise count rates Data is divided into 100 sec bins |
 |
|
| Module-wise count rates for Quadrant A Data is divided into 100 sec bins |
 |
 |
| Module-wise count rates for Quadrant B Data is divided into 100 sec bins |
 |
 |
| Module-wise count rates for Quadrant C Data is divided into 100 sec bins |
 |
 |
| Module-wise count rates for Quadrant D Data is divided into 100 sec bins |
 |
 |
| Parameter | Plot |
|---|---|
| CZT HV Monitor |  |
| D_VDD |  |
| Temperature 1 |  |
| Veto HV Monitor |  |
| Veto LLD |  |
| Alpha Counter |  |
| _CPM_Rate |  |
| CZT Counter |  |
| +2.5 Volts monitor |  |
| +5 Volts monitor |  |
| _ROLL_ROT |  |
| _Roll_DEC |  |
| _Roll_RA |  |
| Veto Counter |  |