| Param | Original file | Final file |
|---|---|---|
| Filename | modeM0/AS1A13_009T02_9000005914cztM0_level2.fits | modeM0/AS1A13_009T02_9000005914cztM0_level2_quad_clean.evt |
| Size (bytes) | 1,079,948,160 | 1,063,716,480 |
| Size | 1.0 GB | 1014.4 MB |
| Events in quadrant A | 6,243,236 | 5,819,170 |
| Events in quadrant B | 6,271,832 | 6,418,757 |
| Events in quadrant C | 6,486,184 | 6,189,471 |
| Events in quadrant D | 5,296,988 | 5,391,201 |
| Mode M9 | |||
|---|---|---|---|
| Quadrant | BADHDUFLAG | Total packets | Discarded packets |
| A | 0 | 139 | 0 |
| B | 0 | 139 | 0 |
| C | 0 | 139 | 0 |
| D | 0 | 139 | 0 |
| Mode SS | |||
|---|---|---|---|
| Quadrant | BADHDUFLAG | Total packets | Discarded packets |
| A | 0 | 2484 | 0 |
| B | 0 | 2484 | 0 |
| C | 0 | 2484 | 0 |
| D | 0 | 2484 | 0 |
| Mode M0 | |||
|---|---|---|---|
| Quadrant | BADHDUFLAG | Total packets | Discarded packets |
| A | 0 | 445872 | 0 |
| B | 0 | 284273 | 0 |
| C | 0 | 272447 | 0 |
| D | 0 | 382352 | 0 |
| Quadrant | Total seconds | Saturated seconds | Saturation percentage |
|---|---|---|---|
| A | 122510 | 13523 | 11.038283% |
| B | 122511 | 3977 | 3.246239% |
| C | 122511 | 1839 | 1.501090% |
| D | 122511 | 11477 | 9.368138% |
Noise dominated data is calculated using 1-second bins in cleaned event files. If a bin has >2000 counts, and if more than 50% of those come from <1% of pixels, then it is considered to be noise-dominated and hence unusable.
| Quadrant | # 1 sec bins | Bins with >0 counts | Bins with >2000 counts | High rate bins dominated by noise | Noise dominated (total time) | Noise dominated (detector-on time) | Marked lightcurve |
|---|---|---|---|---|---|---|---|
| A | 154827 | 122394 | 0 | 0 | 0.00% | 0.00% |  |
| B | 154828 | 122494 | 0 | 0 | 0.00% | 0.00% | 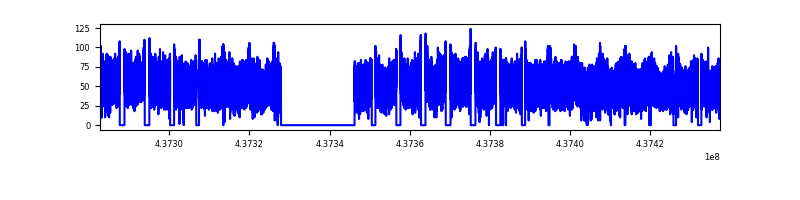 |
| C | 154828 | 122512 | 0 | 0 | 0.00% | 0.00% | 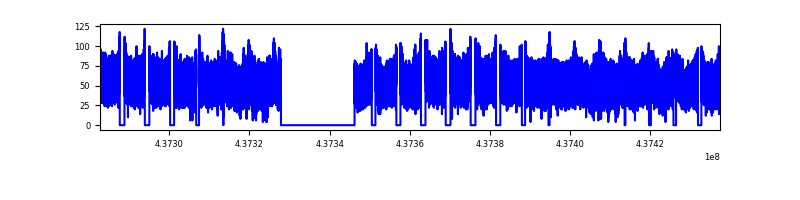 |
| D | 154828 | 122346 | 0 | 0 | 0.00% | 0.00% | 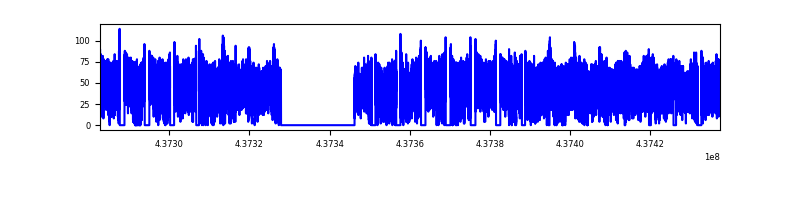 |
Top three noisy pixels from each quadrant. If the there are fewer than three noisy pixels in the level2.evt file, extra rows are filled as -1
| Pixel properties | Quadrant properties | ||||||
|---|---|---|---|---|---|---|---|
| Quadrant | DetID | PixID | Counts | Sigma | Mean | Median | Sigma |
| A | 0 | 29 | 5105 | 8.62 | 1630 | 1520 | 416.0 |
| A | 7 | 110 | 5030 | 8.44 | 1630 | 1520 | 416.0 |
| A | 15 | 236 | 4739 | 7.74 | 1630 | 1520 | 416.0 |
| B | 2 | 9 | 5734 | 12.8 | 1659 | 1577 | 324.6 |
| B | 3 | 17 | 4557 | 9.18 | 1659 | 1577 | 324.6 |
| B | 2 | 8 | 4506 | 9.02 | 1659 | 1577 | 324.6 |
| C | 3 | 202 | 5160 | 8.16 | 1719 | 1596 | 436.8 |
| C | 1 | 81 | 4939 | 7.65 | 1719 | 1596 | 436.8 |
| C | 1 | 80 | 4880 | 7.52 | 1719 | 1596 | 436.8 |
| D | 10 | 189 | 3918 | 6.06 | 1529 | 1385 | 418.1 |
| D | 6 | 38 | 3816 | 5.81 | 1529 | 1385 | 418.1 |
| D | 6 | 67 | 3782 | 5.73 | 1529 | 1385 | 418.1 |
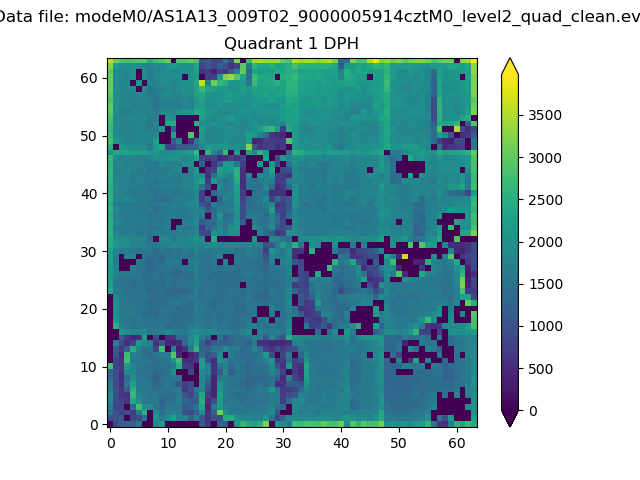
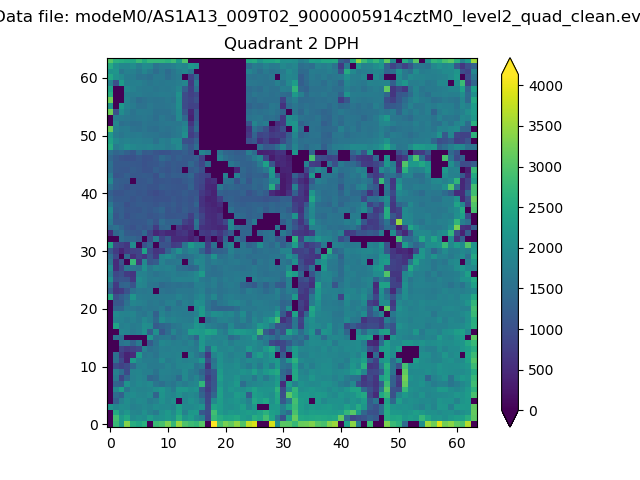
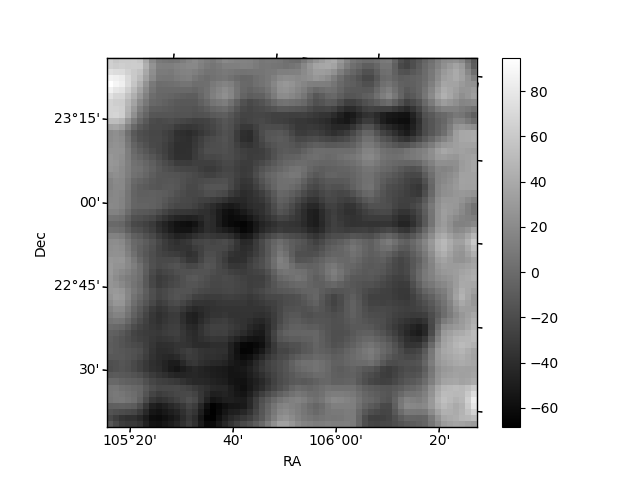
Histogram calculated using DETX and DETY for each event in the final _common_clean file
| Quadrant A | 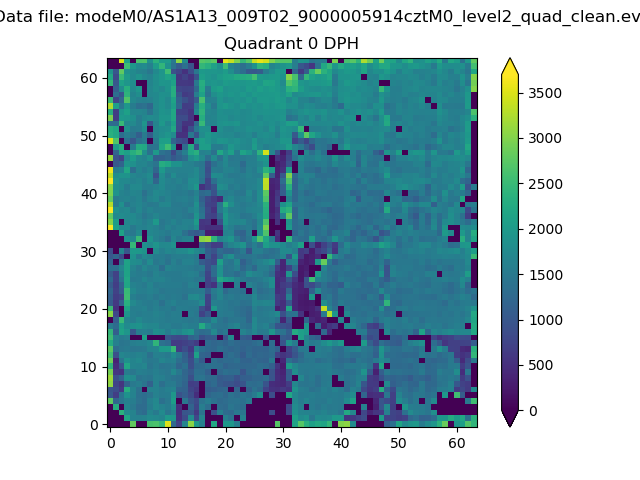 |
 |
Quadrant B |
|---|---|---|---|
| Quadrant D |  |
 |
Quadrant C |
| Plot type | Count rate plots | Images |
|---|---|---|
| Comparison with Poisson distribution Blue bars denote a histogram of data divided into 1 sec bins. Red curve is a Poisson curve with rate = median count rate of data. |
 |
 |
| Quadrant-wise count rates Data is divided into 100 sec bins |
 |
|
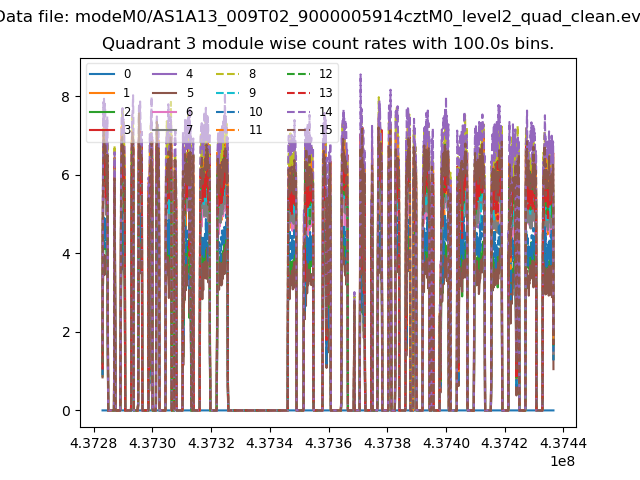
| Module-wise count rates for Quadrant A Data is divided into 100 sec bins |
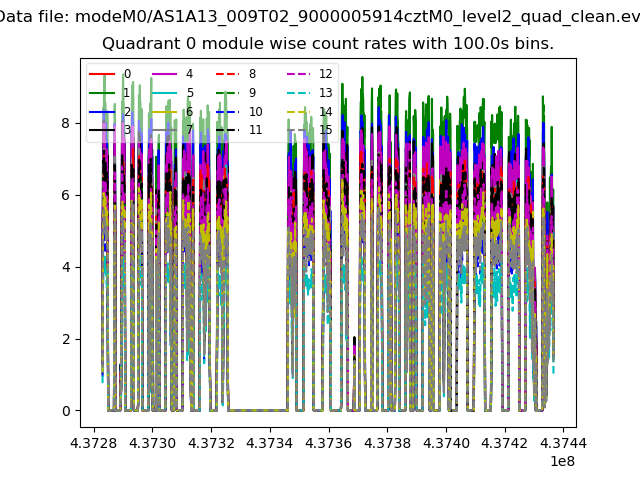 |
 |
| Module-wise count rates for Quadrant B Data is divided into 100 sec bins |
 |
 |
| Module-wise count rates for Quadrant C Data is divided into 100 sec bins |
 |
 |
| Module-wise count rates for Quadrant D Data is divided into 100 sec bins |
 |
 |
| Parameter | Plot |
|---|---|
| CZT HV Monitor |  |
| D_VDD | 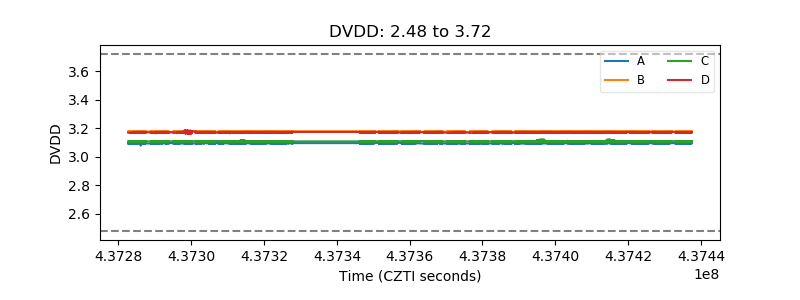 |
| Temperature 1 |  |
| Veto HV Monitor |  |
| Veto LLD |  |
| Alpha Counter |  |
| _CPM_Rate | 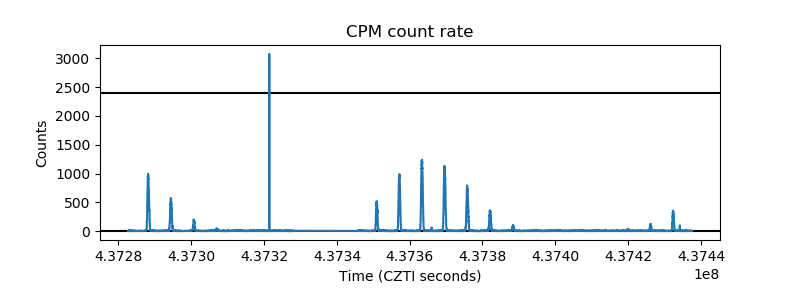 |
| CZT Counter |  |
| +2.5 Volts monitor |  |
| +5 Volts monitor |  |
| _ROLL_ROT |  |
| _Roll_DEC |  |
| _Roll_RA |  |
| Veto Counter |  |