| Param | Original file | Final file |
|---|---|---|
| Filename | modeM0/AS1A13_034T03_9000005926cztM0_level2.fits | modeM0/AS1A13_034T03_9000005926cztM0_level2_quad_clean.evt |
| Size (bytes) | 258,261,120 | 248,016,960 |
| Size | 246.3 MB | 236.5 MB |
| Events in quadrant A | 1,453,758 | 1,332,483 |
| Events in quadrant B | 1,510,874 | 1,496,597 |
| Events in quadrant C | 1,560,892 | 1,450,400 |
| Events in quadrant D | 1,300,774 | 1,238,424 |
| Mode M9 | |||
|---|---|---|---|
| Quadrant | BADHDUFLAG | Total packets | Discarded packets |
| A | 0 | 27 | 0 |
| B | 0 | 28 | 0 |
| C | 0 | 28 | 0 |
| D | 0 | 28 | 0 |
| Mode SS | |||
|---|---|---|---|
| Quadrant | BADHDUFLAG | Total packets | Discarded packets |
| A | 0 | 588 | 0 |
| B | 0 | 588 | 0 |
| C | 0 | 588 | 0 |
| D | 0 | 588 | 0 |
| Mode M0 | |||
|---|---|---|---|
| Quadrant | BADHDUFLAG | Total packets | Discarded packets |
| A | 0 | 102121 | 0 |
| B | 0 | 62262 | 0 |
| C | 0 | 65487 | 0 |
| D | 0 | 82710 | 0 |
| Quadrant | Total seconds | Saturated seconds | Saturation percentage |
|---|---|---|---|
| A | 28977 | 3815 | 13.165614% |
| B | 28981 | 857 | 2.957110% |
| C | 28979 | 650 | 2.243004% |
| D | 28981 | 1852 | 6.390394% |
Noise dominated data is calculated using 1-second bins in cleaned event files. If a bin has >2000 counts, and if more than 50% of those come from <1% of pixels, then it is considered to be noise-dominated and hence unusable.
| Quadrant | # 1 sec bins | Bins with >0 counts | Bins with >2000 counts | High rate bins dominated by noise | Noise dominated (total time) | Noise dominated (detector-on time) | Marked lightcurve |
|---|---|---|---|---|---|---|---|
| A | 34689 | 28929 | 0 | 0 | 0.00% | 0.00% |  |
| B | 34689 | 28981 | 0 | 0 | 0.00% | 0.00% | 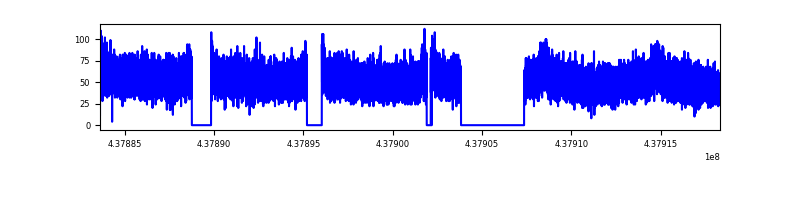 |
| C | 34689 | 28981 | 0 | 0 | 0.00% | 0.00% |  |
| D | 34689 | 28942 | 0 | 0 | 0.00% | 0.00% |  |
Top three noisy pixels from each quadrant. If the there are fewer than three noisy pixels in the level2.evt file, extra rows are filled as -1
| Pixel properties | Quadrant properties | ||||||
|---|---|---|---|---|---|---|---|
| Quadrant | DetID | PixID | Counts | Sigma | Mean | Median | Sigma |
| A | 7 | 110 | 1248 | 9.1 | 379 | 355 | 98.1 |
| A | 0 | 29 | 1187 | 8.48 | 379 | 355 | 98.1 |
| A | 14 | 95 | 1156 | 8.16 | 379 | 355 | 98.1 |
| B | 2 | 9 | 1380 | 12.35 | 398 | 378 | 81.1 |
| B | 3 | 17 | 1099 | 8.89 | 398 | 378 | 81.1 |
| B | 5 | 255 | 1071 | 8.54 | 398 | 378 | 81.1 |
| C | 3 | 202 | 1214 | 7.67 | 412 | 382 | 108.5 |
| C | 1 | 81 | 1197 | 7.51 | 412 | 382 | 108.5 |
| C | 3 | 203 | 1141 | 7.0 | 412 | 382 | 108.5 |
| D | 10 | 189 | 930 | 5.67 | 374 | 340 | 104.1 |
| D | 4 | 63 | 928 | 5.65 | 374 | 340 | 104.1 |
| D | 3 | 14 | 927 | 5.64 | 374 | 340 | 104.1 |
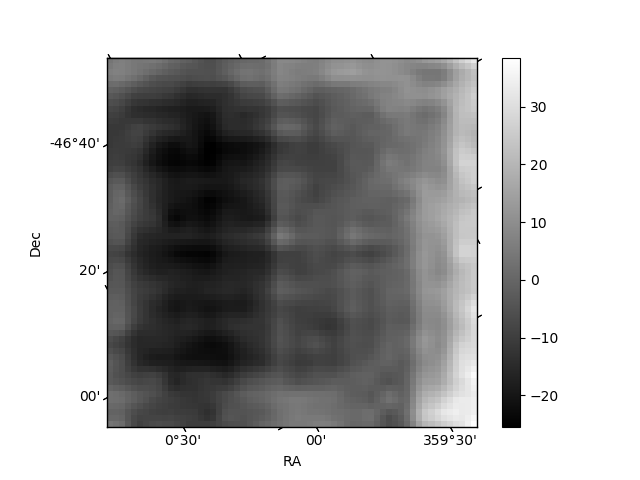
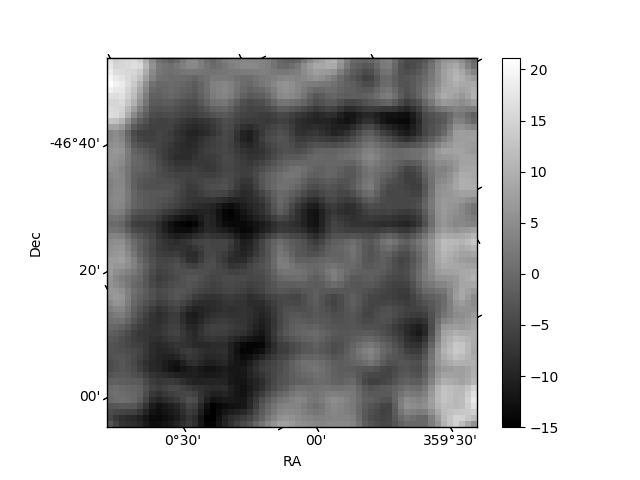
Histogram calculated using DETX and DETY for each event in the final _common_clean file
| Quadrant A | 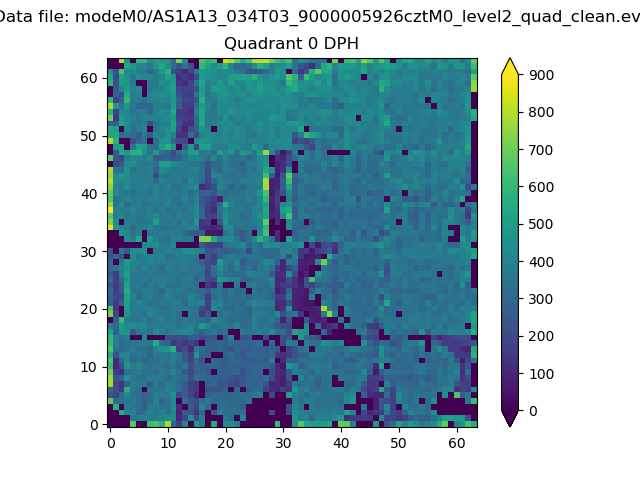 |
 |
Quadrant B |
|---|---|---|---|
| Quadrant D |  |
 |
Quadrant C |
| Plot type | Count rate plots | Images |
|---|---|---|
| Comparison with Poisson distribution Blue bars denote a histogram of data divided into 1 sec bins. Red curve is a Poisson curve with rate = median count rate of data. |
 |
 |
| Quadrant-wise count rates Data is divided into 100 sec bins |
 |
|
| Module-wise count rates for Quadrant A Data is divided into 100 sec bins |
 |
 |
| Module-wise count rates for Quadrant B Data is divided into 100 sec bins |
 |
 |
| Module-wise count rates for Quadrant C Data is divided into 100 sec bins |
 |
 |
| Module-wise count rates for Quadrant D Data is divided into 100 sec bins |
 |
 |
| Parameter | Plot |
|---|---|
| CZT HV Monitor | 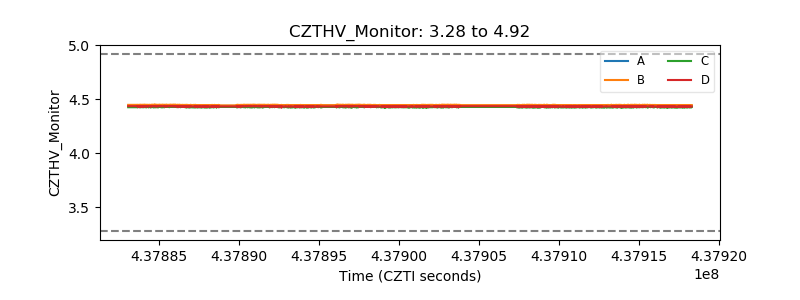 |
| D_VDD |  |
| Temperature 1 |  |
| Veto HV Monitor |  |
| Veto LLD |  |
| Alpha Counter |  |
| _CPM_Rate |  |
| CZT Counter |  |
| +2.5 Volts monitor |  |
| +5 Volts monitor |  |
| _ROLL_ROT |  |
| _Roll_DEC |  |
| _Roll_RA |  |
| Veto Counter |  |