| Param | Original file | Final file |
|---|---|---|
| Filename | modeM0/AS1A13_037T01_9000005930cztM0_level2.fits | modeM0/AS1A13_037T01_9000005930cztM0_level2_quad_clean.evt |
| Size (bytes) | 497,053,440 | 495,391,680 |
| Size | 474.0 MB | 472.4 MB |
| Events in quadrant A | 2,918,748 | 2,849,407 |
| Events in quadrant B | 2,897,498 | 3,033,303 |
| Events in quadrant C | 2,962,642 | 2,864,119 |
| Events in quadrant D | 2,481,424 | 2,465,149 |
| Mode SS | |||
|---|---|---|---|
| Quadrant | BADHDUFLAG | Total packets | Discarded packets |
| A | 0 | 1120 | 0 |
| B | 0 | 1120 | 0 |
| C | 0 | 1120 | 0 |
| D | 0 | 1120 | 0 |
| Mode M0 | |||
|---|---|---|---|
| Quadrant | BADHDUFLAG | Total packets | Discarded packets |
| A | 0 | 157038 | 0 |
| B | 0 | 118145 | 0 |
| C | 0 | 126921 | 0 |
| D | 0 | 148145 | 0 |
| Mode M9 | |||
|---|---|---|---|
| Quadrant | BADHDUFLAG | Total packets | Discarded packets |
| A | 0 | 68 | 0 |
| B | 0 | 69 | 0 |
| C | 0 | 69 | 0 |
| D | 0 | 69 | 0 |
| Quadrant | Total seconds | Saturated seconds | Saturation percentage |
|---|---|---|---|
| A | 55249 | 2708 | 4.901446% |
| B | 55247 | 1115 | 2.018209% |
| C | 55248 | 833 | 1.507747% |
| D | 55248 | 2547 | 4.610122% |
Noise dominated data is calculated using 1-second bins in cleaned event files. If a bin has >2000 counts, and if more than 50% of those come from <1% of pixels, then it is considered to be noise-dominated and hence unusable.
| Quadrant | # 1 sec bins | Bins with >0 counts | Bins with >2000 counts | High rate bins dominated by noise | Noise dominated (total time) | Noise dominated (detector-on time) | Marked lightcurve |
|---|---|---|---|---|---|---|---|
| A | 64557 | 55246 | 0 | 0 | 0.00% | 0.00% |  |
| B | 64557 | 55248 | 0 | 0 | 0.00% | 0.00% |  |
| C | 64557 | 55249 | 0 | 0 | 0.00% | 0.00% |  |
| D | 64557 | 55191 | 0 | 0 | 0.00% | 0.00% |  |
Top three noisy pixels from each quadrant. If the there are fewer than three noisy pixels in the level2.evt file, extra rows are filled as -1
| Pixel properties | Quadrant properties | ||||||
|---|---|---|---|---|---|---|---|
| Quadrant | DetID | PixID | Counts | Sigma | Mean | Median | Sigma |
| A | 7 | 110 | 2359 | 8.5 | 761 | 711 | 193.8 |
| A | 0 | 29 | 2336 | 8.38 | 761 | 711 | 193.8 |
| A | 7 | 109 | 2249 | 7.93 | 761 | 711 | 193.8 |
| B | 2 | 9 | 2682 | 12.89 | 766 | 729 | 151.5 |
| B | 2 | 8 | 2165 | 9.48 | 766 | 729 | 151.5 |
| B | 3 | 17 | 2165 | 9.48 | 766 | 729 | 151.5 |
| C | 3 | 202 | 2244 | 7.54 | 783 | 728 | 201.1 |
| C | 1 | 81 | 2226 | 7.45 | 783 | 728 | 201.1 |
| C | 1 | 80 | 2214 | 7.39 | 783 | 728 | 201.1 |
| D | 7 | 3 | 1843 | 6.03 | 713 | 646 | 198.6 |
| D | 3 | 14 | 1836 | 5.99 | 713 | 646 | 198.6 |
| D | 10 | 189 | 1835 | 5.99 | 713 | 646 | 198.6 |
Histogram calculated using DETX and DETY for each event in the final _common_clean file
| Quadrant A |  |
 |
Quadrant B |
|---|---|---|---|
| Quadrant D | 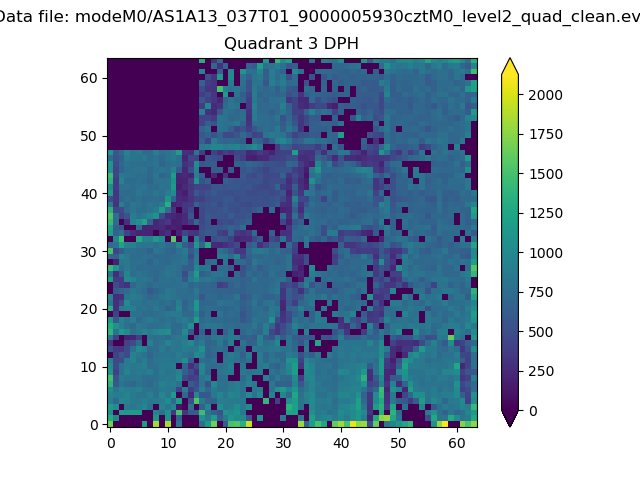 |
 |
Quadrant C |
| Plot type | Count rate plots | Images |
|---|---|---|
| Comparison with Poisson distribution Blue bars denote a histogram of data divided into 1 sec bins. Red curve is a Poisson curve with rate = median count rate of data. |
 |
 |
| Quadrant-wise count rates Data is divided into 100 sec bins |
 |
|
| Module-wise count rates for Quadrant A Data is divided into 100 sec bins |
 |
 |
| Module-wise count rates for Quadrant B Data is divided into 100 sec bins |
 |
 |
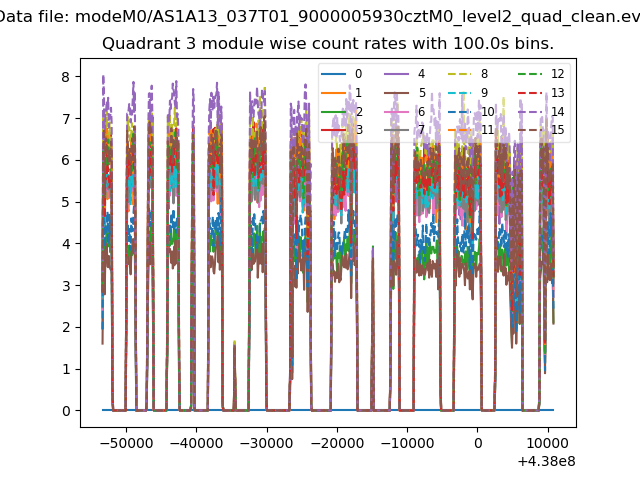
| Module-wise count rates for Quadrant C Data is divided into 100 sec bins |
 |
 |
| Module-wise count rates for Quadrant D Data is divided into 100 sec bins |
 |
 |
| Parameter | Plot |
|---|---|
| CZT HV Monitor |  |
| D_VDD |  |
| Temperature 1 |  |
| Veto HV Monitor |  |
| Veto LLD |  |
| Alpha Counter |  |
| _CPM_Rate |  |
| CZT Counter |  |
| +2.5 Volts monitor |  |
| +5 Volts monitor |  |
| _ROLL_ROT |  |
| _Roll_DEC |  |
| _Roll_RA |  |
| Veto Counter |  |