| Param | Original file | Final file |
|---|---|---|
| Filename | modeM0/AS1A13_023T01_9000005932cztM0_level2.fits | modeM0/AS1A13_023T01_9000005932cztM0_level2_quad_clean.evt |
| Size (bytes) | 179,870,400 | 153,789,120 |
| Size | 171.5 MB | 146.7 MB |
| Events in quadrant A | 1,057,438 | 854,130 |
| Events in quadrant B | 1,037,932 | 864,997 |
| Events in quadrant C | 1,065,456 | 817,542 |
| Events in quadrant D | 889,300 | 723,016 |
| Mode M9 | |||
|---|---|---|---|
| Quadrant | BADHDUFLAG | Total packets | Discarded packets |
| A | 0 | 35 | 0 |
| B | 0 | 35 | 0 |
| C | 0 | 35 | 0 |
| D | 0 | 35 | 0 |
| Mode SS | |||
|---|---|---|---|
| Quadrant | BADHDUFLAG | Total packets | Discarded packets |
| A | 0 | 414 | 0 |
| B | 0 | 414 | 0 |
| C | 0 | 414 | 0 |
| D | 0 | 414 | 0 |
| Mode M0 | |||
|---|---|---|---|
| Quadrant | BADHDUFLAG | Total packets | Discarded packets |
| A | 0 | 55351 | 0 |
| B | 0 | 43845 | 0 |
| C | 0 | 46323 | 0 |
| D | 0 | 55772 | 0 |
| Quadrant | Total seconds | Saturated seconds | Saturation percentage |
|---|---|---|---|
| A | 20282 | 411 | 2.026427% |
| B | 20282 | 229 | 1.129080% |
| C | 20282 | 153 | 0.754363% |
| D | 20282 | 1218 | 6.005325% |
Noise dominated data is calculated using 1-second bins in cleaned event files. If a bin has >2000 counts, and if more than 50% of those come from <1% of pixels, then it is considered to be noise-dominated and hence unusable.
| Quadrant | # 1 sec bins | Bins with >0 counts | Bins with >2000 counts | High rate bins dominated by noise | Noise dominated (total time) | Noise dominated (detector-on time) | Marked lightcurve |
|---|---|---|---|---|---|---|---|
| A | 23727 | 20281 | 0 | 0 | 0.00% | 0.00% |  |
| B | 23727 | 20282 | 0 | 0 | 0.00% | 0.00% |  |
| C | 23727 | 20282 | 0 | 0 | 0.00% | 0.00% |  |
| D | 23727 | 20273 | 0 | 0 | 0.00% | 0.00% |  |
Top three noisy pixels from each quadrant. If the there are fewer than three noisy pixels in the level2.evt file, extra rows are filled as -1
| Pixel properties | Quadrant properties | ||||||
|---|---|---|---|---|---|---|---|
| Quadrant | DetID | PixID | Counts | Sigma | Mean | Median | Sigma |
| A | 7 | 110 | 889 | 8.76 | 275 | 257 | 72.1 |
| A | 0 | 29 | 879 | 8.62 | 275 | 257 | 72.1 |
| A | 0 | 30 | 810 | 7.66 | 275 | 257 | 72.1 |
| B | 2 | 9 | 886 | 10.82 | 274 | 260 | 57.9 |
| B | 3 | 17 | 752 | 8.5 | 274 | 260 | 57.9 |
| B | 2 | 8 | 722 | 7.98 | 274 | 260 | 57.9 |
| C | 1 | 81 | 842 | 7.67 | 281 | 261 | 75.7 |
| C | 1 | 80 | 842 | 7.67 | 281 | 261 | 75.7 |
| C | 3 | 202 | 835 | 7.58 | 281 | 261 | 75.7 |
| D | 10 | 113 | 654 | 5.79 | 254 | 230 | 73.2 |
| D | 12 | 6 | 639 | 5.58 | 254 | 230 | 73.2 |
| D | 6 | 38 | 639 | 5.58 | 254 | 230 | 73.2 |
Histogram calculated using DETX and DETY for each event in the final _common_clean file
| Quadrant A |  |
 |
Quadrant B |
|---|---|---|---|
| Quadrant D |  |
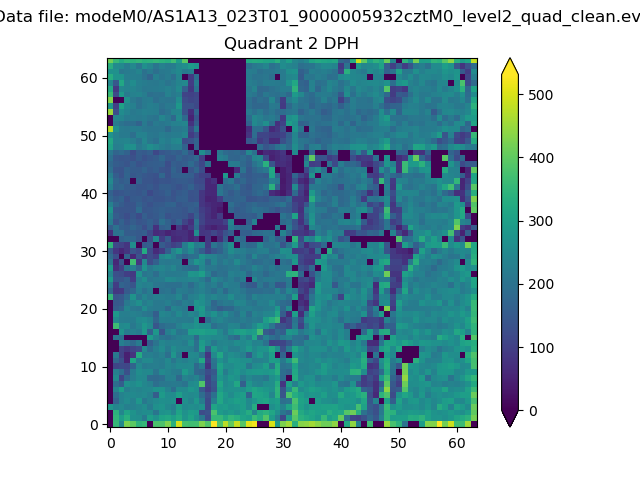 |
Quadrant C |
| Plot type | Count rate plots | Images |
|---|---|---|
| Comparison with Poisson distribution Blue bars denote a histogram of data divided into 1 sec bins. Red curve is a Poisson curve with rate = median count rate of data. |
 |
 |
| Quadrant-wise count rates Data is divided into 100 sec bins |
 |
|
| Module-wise count rates for Quadrant A Data is divided into 100 sec bins |
 |
 |
| Module-wise count rates for Quadrant B Data is divided into 100 sec bins |
 |
 |
| Module-wise count rates for Quadrant C Data is divided into 100 sec bins |
 |
 |
| Module-wise count rates for Quadrant D Data is divided into 100 sec bins |
 |
 |
| Parameter | Plot |
|---|---|
| CZT HV Monitor |  |
| D_VDD |  |
| Temperature 1 |  |
| Veto HV Monitor |  |
| Veto LLD |  |
| Alpha Counter |  |
| _CPM_Rate |  |
| CZT Counter |  |
| +2.5 Volts monitor |  |
| +5 Volts monitor |  |
| _ROLL_ROT |  |
| _Roll_DEC |  |
| _Roll_RA |  |
| Veto Counter |  |