| Param | Original file | Final file |
|---|---|---|
| Filename | modeM0/AS1A13_023T03_9000005934cztM0_level2.fits | modeM0/AS1A13_023T03_9000005934cztM0_level2_quad_clean.evt |
| Size (bytes) | 415,143,360 | 341,576,640 |
| Size | 395.9 MB | 325.8 MB |
| Events in quadrant A | 2,479,084 | 1,883,142 |
| Events in quadrant B | 2,431,464 | 1,914,447 |
| Events in quadrant C | 2,498,846 | 1,842,320 |
| Events in quadrant D | 2,040,884 | 1,583,072 |
| Mode SS | |||
|---|---|---|---|
| Quadrant | BADHDUFLAG | Total packets | Discarded packets |
| A | 0 | 922 | 0 |
| B | 0 | 922 | 0 |
| C | 0 | 922 | 0 |
| D | 0 | 922 | 0 |
| Mode M9 | |||
|---|---|---|---|
| Quadrant | BADHDUFLAG | Total packets | Discarded packets |
| A | 0 | 60 | 0 |
| B | 0 | 60 | 0 |
| C | 0 | 60 | 0 |
| D | 0 | 60 | 0 |
| Mode M0 | |||
|---|---|---|---|
| Quadrant | BADHDUFLAG | Total packets | Discarded packets |
| A | 0 | 116973 | 0 |
| B | 0 | 98449 | 0 |
| C | 0 | 99599 | 0 |
| D | 0 | 141654 | 0 |
| Quadrant | Total seconds | Saturated seconds | Saturation percentage |
|---|---|---|---|
| A | 45463 | 800 | 1.759673% |
| B | 45463 | 928 | 2.041220% |
| C | 45465 | 477 | 1.049159% |
| D | 45462 | 3933 | 8.651181% |
Noise dominated data is calculated using 1-second bins in cleaned event files. If a bin has >2000 counts, and if more than 50% of those come from <1% of pixels, then it is considered to be noise-dominated and hence unusable.
| Quadrant | # 1 sec bins | Bins with >0 counts | Bins with >2000 counts | High rate bins dominated by noise | Noise dominated (total time) | Noise dominated (detector-on time) | Marked lightcurve |
|---|---|---|---|---|---|---|---|
| A | 51405 | 45461 | 0 | 0 | 0.00% | 0.00% |  |
| B | 51405 | 45464 | 0 | 0 | 0.00% | 0.00% | 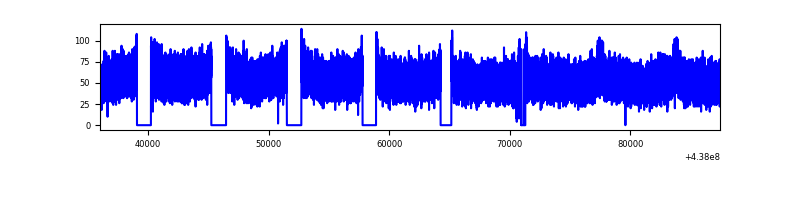 |
| C | 51405 | 45458 | 0 | 0 | 0.00% | 0.00% | 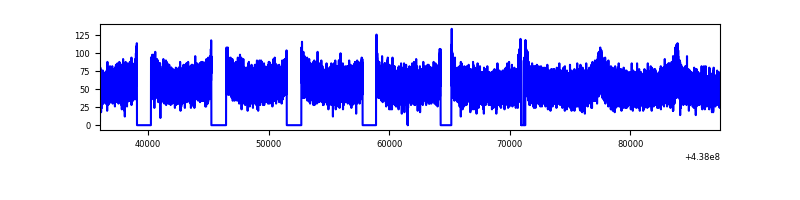 |
| D | 51405 | 45411 | 0 | 0 | 0.00% | 0.00% |  |
Top three noisy pixels from each quadrant. If the there are fewer than three noisy pixels in the level2.evt file, extra rows are filled as -1
| Pixel properties | Quadrant properties | ||||||
|---|---|---|---|---|---|---|---|
| Quadrant | DetID | PixID | Counts | Sigma | Mean | Median | Sigma |
| A | 7 | 110 | 2073 | 8.89 | 646 | 602 | 165.4 |
| A | 15 | 236 | 1988 | 8.38 | 646 | 602 | 165.4 |
| A | 14 | 95 | 1915 | 7.94 | 646 | 602 | 165.4 |
| B | 2 | 9 | 2231 | 12.2 | 642 | 608 | 133.0 |
| B | 2 | 8 | 1783 | 8.83 | 642 | 608 | 133.0 |
| B | 5 | 232 | 1709 | 8.28 | 642 | 608 | 133.0 |
| C | 1 | 81 | 1893 | 7.42 | 660 | 613 | 172.4 |
| C | 3 | 202 | 1873 | 7.31 | 660 | 613 | 172.4 |
| C | 1 | 80 | 1852 | 7.19 | 660 | 613 | 172.4 |
| D | 10 | 189 | 1478 | 5.81 | 585 | 530 | 163.3 |
| D | 3 | 14 | 1478 | 5.81 | 585 | 530 | 163.3 |
| D | 4 | 12 | 1472 | 5.77 | 585 | 530 | 163.3 |
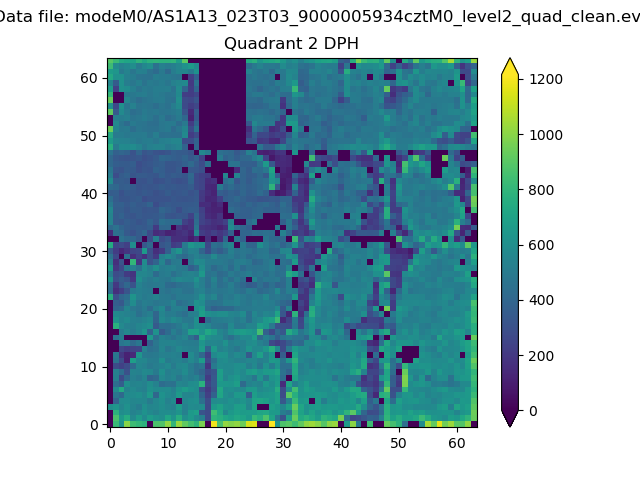
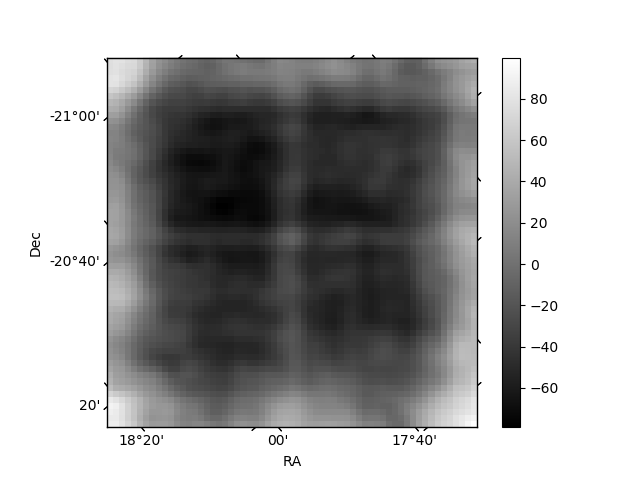
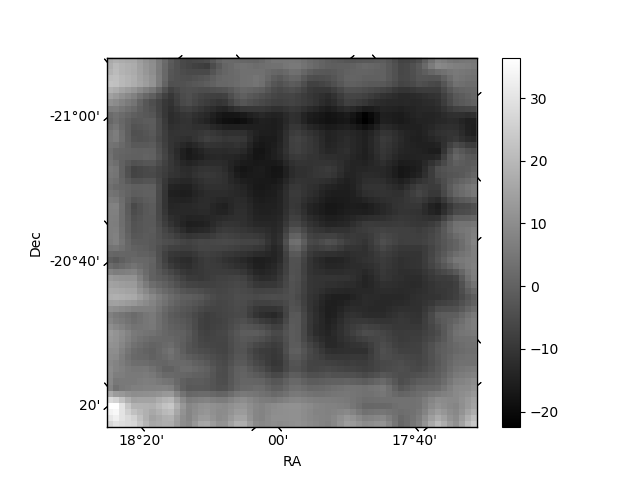
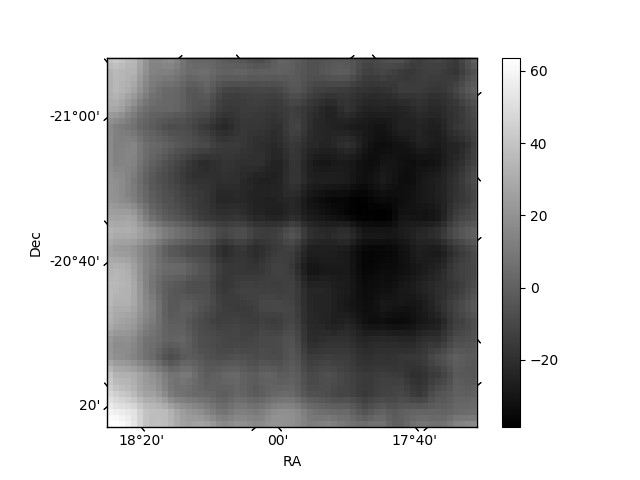
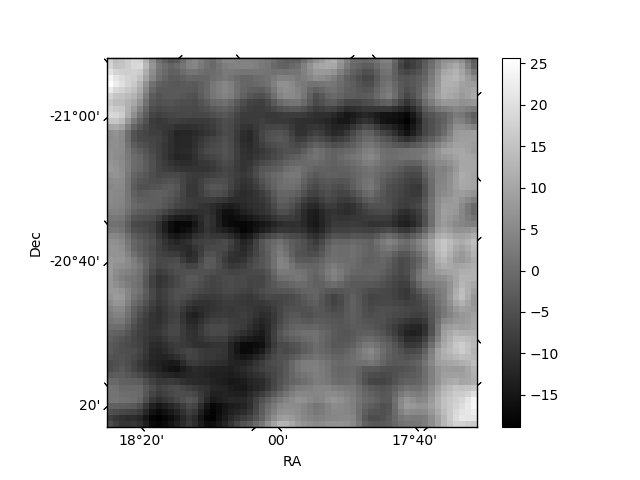
Histogram calculated using DETX and DETY for each event in the final _common_clean file
| Quadrant A |  |
 |
Quadrant B |
|---|---|---|---|
| Quadrant D | 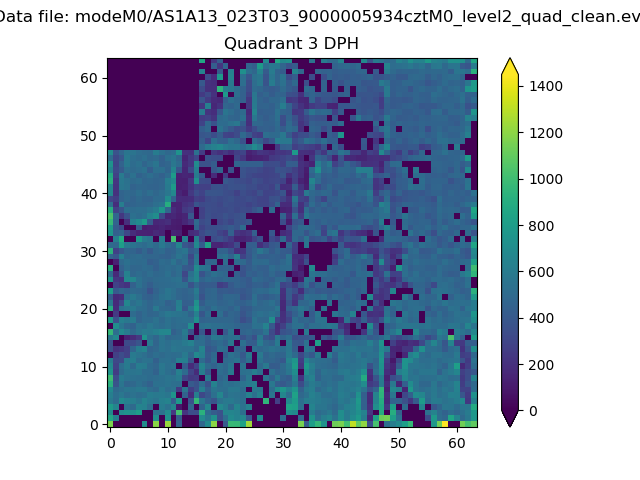 |
 |
Quadrant C |
| Plot type | Count rate plots | Images |
|---|---|---|
| Comparison with Poisson distribution Blue bars denote a histogram of data divided into 1 sec bins. Red curve is a Poisson curve with rate = median count rate of data. |
 |
 |
| Quadrant-wise count rates Data is divided into 100 sec bins |
 |
|
| Module-wise count rates for Quadrant A Data is divided into 100 sec bins |
 |
 |
| Module-wise count rates for Quadrant B Data is divided into 100 sec bins |
 |
 |
| Module-wise count rates for Quadrant C Data is divided into 100 sec bins |
 |
 |
| Module-wise count rates for Quadrant D Data is divided into 100 sec bins |
 |
 |
| Parameter | Plot |
|---|---|
| CZT HV Monitor |  |
| D_VDD | 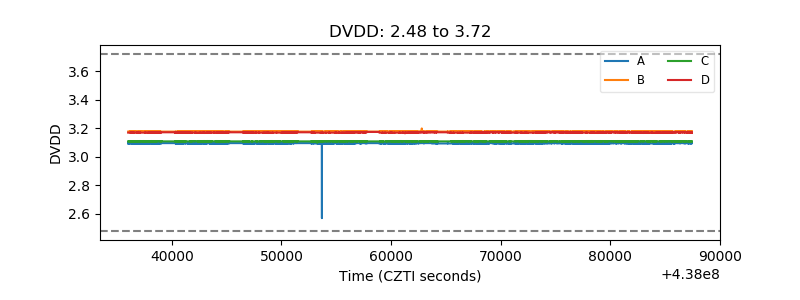 |
| Temperature 1 | 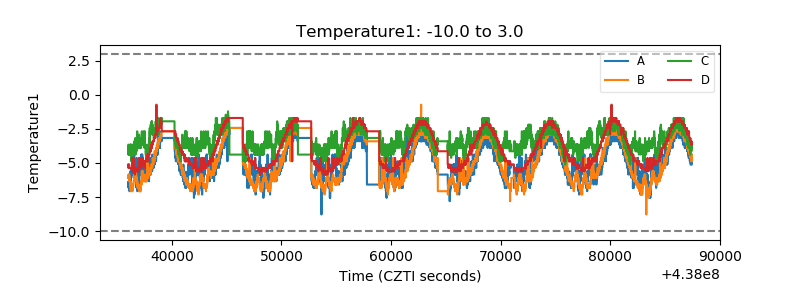 |
| Veto HV Monitor | 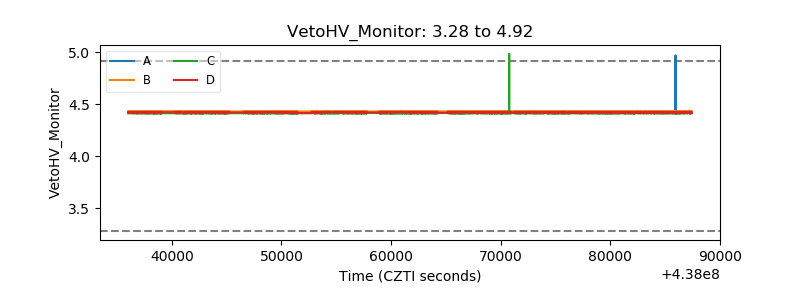 |
| Veto LLD |  |
| Alpha Counter |  |
| _CPM_Rate |  |
| CZT Counter | 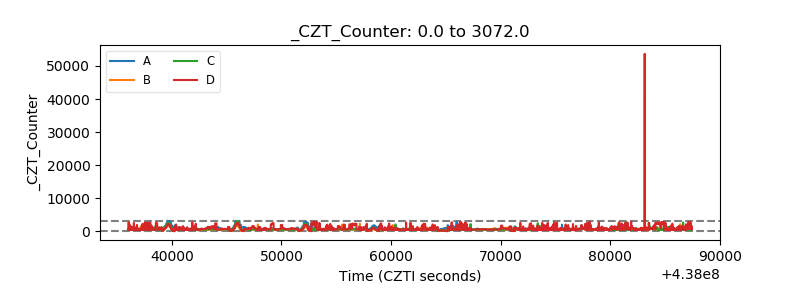 |
| +2.5 Volts monitor | 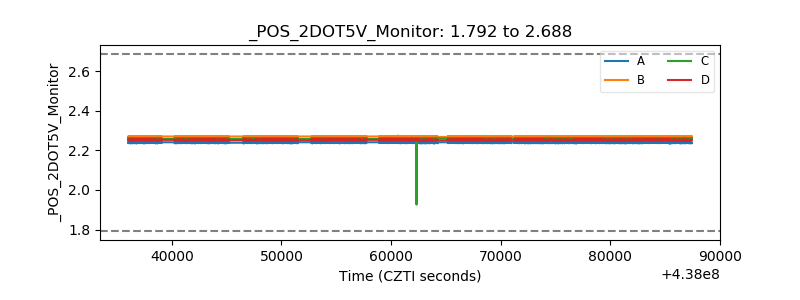 |
| +5 Volts monitor |  |
| _ROLL_ROT |  |
| _Roll_DEC |  |
| _Roll_RA |  |
| Veto Counter | 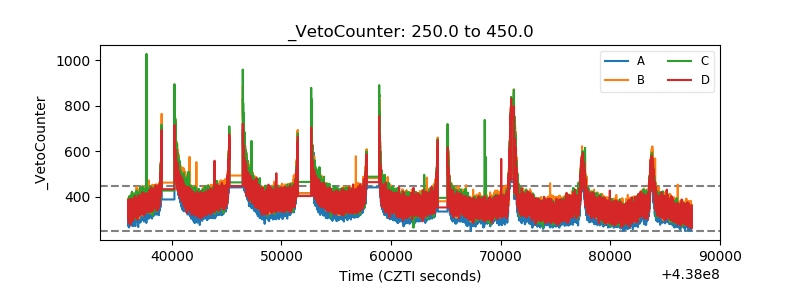 |